ERS Charts of Note
Subscribe to get highlights from our current and past research, Monday through Friday, or see our privacy policy.
Get the latest charts via email, or on our mobile app for  and
and 
Wednesday, March 22, 2023
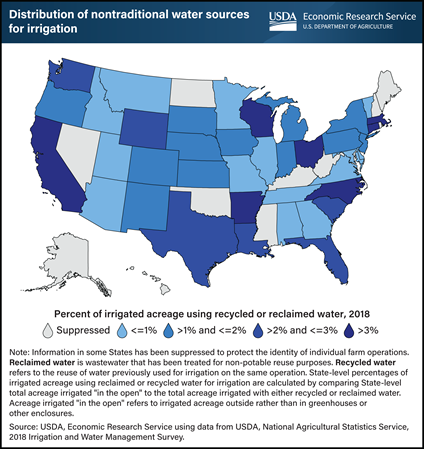
Water scarcity and water quality concerns in the United States have resulted in using nontraditional water sources, including recycled and reclaimed water, for irrigation. In 2018, producers used recycled and reclaimed water to irrigate crops on about 1.5 million acres in the United States, the most recent year for which data are available. Some acreage may use both recycled and reclaimed water for irrigation. California, Arkansas, Wisconsin, Ohio, North Carolina, Connecticut, and Massachusetts had the highest proportion of acreage where producers applied recycled or reclaimed water. In all these States, at least 3 percent of irrigated acreage relies on recycled or reclaimed water to meet crop irrigation needs. Reclaimed water for use on farms comes from sources such as industrial, municipal, and off-farm and on-farm animal operations. Municipal and on-farm animal operations were the most common sources of reclaimed water of the farms using reclaimed water in 2018. This chart was drawn from data collected by the USDA, National Agricultural Statistics Service.
Thursday, February 16, 2023
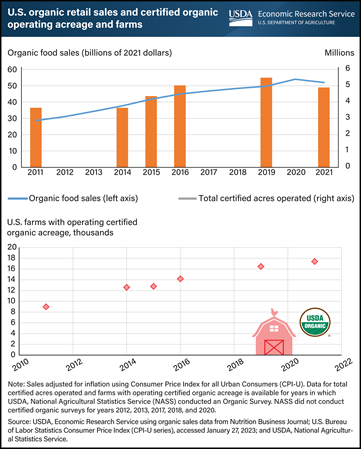
The organic market has seen continued growth in retail sales in the past decade. U.S. organic retail sales increased by an average of 8 percent per year and surpassed $53 billion in 2020 (inflation-adjusted to 2021 dollars). In 2021, sales were $52 billion, which was a 6-percent annual decline when adjusted for inflation, but a slight increase when not inflation-adjusted. Additionally, the number of certified organic acres operated increased gradually from 3.6 million in 2011 to 4.9 million acres in 2021. The number of certified farms with operating organic acres in the United States nearly doubled over the past decade to 17,409 from about 8,978. Between 2019 and 2021, the number of certified organic farms in the United States increased 5 percent, while total organic land decreased by 11 percent, driven by a 36-percent decrease in pasture and rangeland. These latest data were released in the 2021 Certified Organic Survey on December 15, 2022, by USDA, National Agricultural Statistics Service with cooperation from USDA's Risk Management Agency, which is the first organic survey released by USDA since 2019. The U.S. organic retail sales data provided by Nutrition Business Journal were adjusted for inflation and are available on USDA, Economic Research Service’s Organic Agriculture topic page, updated February 2023.
Tuesday, December 6, 2022
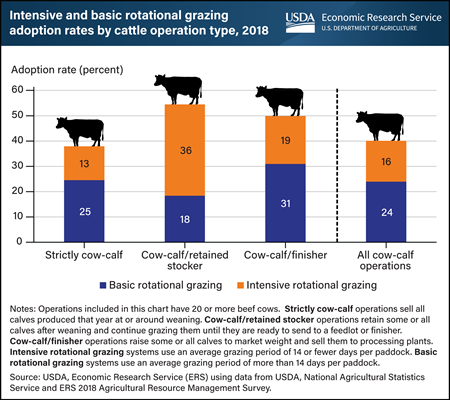
Rotational grazing is a management practice in which ranchers rotate cattle through a series of paddocks. It is an alternative to continuous grazing in which cattle stay on a single pasture. About 40 percent of all cow-calf operations reported using a rotational grazing system, with cow-calf/retained stocker producers leading adoption. Retained stockers keep one or more of their calves through the initial feeder stage for later sale to feedlots. Based on data collected from the 2018 Agricultural Resource Management Survey (ARMS) Cattle and Calves Cost and Returns Report, 54 percent of retained stocker operations have adopted some form of rotational grazing. This adoption rate is more than the rate for strictly cow-calf producers, who sell all calves at or around weaning (38 percent), or retained finisher producers, who retain calves until market weight (50 percent). Retained stockers are much more likely to employ intensive rotational grazing systems, which use an average grazing period of 14 or fewer days per paddock, than strictly cow-calf operations and finishers. Across all forms of cow-calf operations, 16 percent of producers use intensive rotational grazing and 24 percent use basic rotational grazing (using an average grazing period longer than 14 days per paddock). The type of grazing system an operator selects can be part of managing forage production, forage quality, animal health, and environmental quality. This chart appears in the USDA, Economic Research Service report Rotational Grazing Adoption by Cow-Calf Operations, published in November 2022.
Monday, December 5, 2022
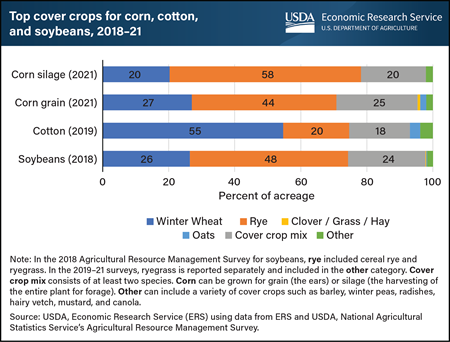
Farmers add cover crops to a rotation to provide living, seasonal soil cover between the planting of two cash (commodity) or forage crops. Including cover crops in a rotation can provide benefits such as improved soil health and water quality, weed suppression, and reduced soil erosion. Data from the field-level USDA Agricultural Resource Management Survey (ARMS) provide information on which cover crops were grown in the fall before planting corn, cotton, and soybeans. Cover crop mixes account for 18 to 25 percent of acres with cover crops. However, the use of single-species cover crops is more common. For corn fields in 2021, almost 75 percent of acres with cover crops used a grass or small grain cover crop, such as cereal rye, winter wheat, or oats. At 44 percent of acreage, cereal rye was almost twice as common as winter wheat (27 percent) as the cover crop on corn for grain fields. Rye and winter wheat were also the most common cover crops on soybean fields in 2018. Winter wheat was the most common cover crop used on cotton fields in 2019. The original version of this chart appears in the USDA, Economic Research Service report Cover Crop Trends, Programs, and Practices in the United States, released in 2021.
Tuesday, October 25, 2022
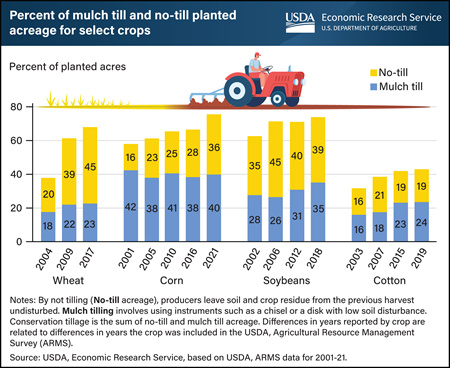
The share of acreage for major cash crops—wheat, corn, soybeans, and cotton—that are planted using conservation tillage has increased over the past two decades in the United States. Conservation tillage, which includes no-till and mulch till, reduces soil disturbance and preserves more crop residue relative to conventional tillage, in which a plow or other implement turns over most of the soil before planting. Conservation tillage promotes soil health and reduces soil erosion and nutrient runoff. In representative surveys, farmers reported employing conservation tillage on the majority of acres of wheat (68 percent), corn (76 percent), and soybeans (74 percent). Conservation tillage is less common on cotton fields (43 percent of acres). No-till production, a type of conservation tillage in which farmers plant directly into remaining crop residue without tilling, has increased substantially for wheat and corn over the past two decades. On wheat acres, no-till increased from 20 percent in 2004 to 39 percent in 2009 before rising to 45 percent in 2017. For corn acres, no-till increased from 16 percent in 2001 to 36 percent in 2021, including a jump from 28 percent in 2016. Mulch till, which aims to reduce soil disturbance through fewer and less intensive tillage operations than conventional production, accounted for about half of conservation tillage acres on corn and slightly more than half of conservation tillage on cotton. Mulch till has trended upward on each crop except for corn over the past two decades, including a recent increase for soybean acres from 31 percent in 2012 to 35 percent in 2018. This chart updates information in the USDA, Economic Research Service bulletin Tillage Intensity and Conservation Cropping in the United States, published in 2018.
_450px.png?v=6632.7)
Tuesday, September 27, 2022
As of September 19, 2022 the U.S. Drought Monitor (USDM) classified more than 18 percent of land in the Western States as experiencing extreme or exceptional drought. Data reported by USDM show that drought in the Western States during the summers of 2021 and 2022 exceeded the intensity of all past droughts in the region since 2000. Drought conditions in the Western States gradually subsided in the latter months of 2021 but began intensifying again during the first half of 2022. The USDM categorizes drought in a region according to soil moisture, streamflow, and precipitation levels. Regional designations are primarily based on historical weather patterns. For agriculture, drought can mean diminished crop and livestock outputs, as well as reduced farm profitability. Drought also reduces the quantity of snowpack and streamflow available for diversions to irrigated agricultural land. These impacts can reverberate throughout the local, regional, and national economies. Find additional information on the USDA, Economic Research Service’s newsroom page Drought in the Western United States.
Tuesday, September 13, 2022
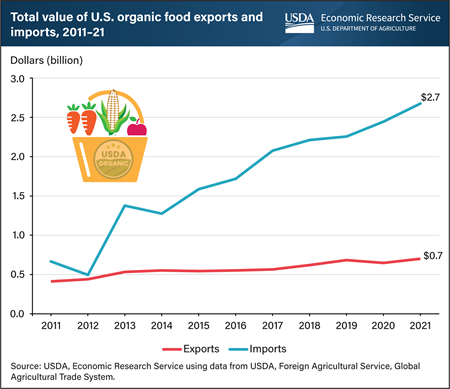
The U.S. Department of Commerce actively tracks organic food in 37 export and 57 import categories. Tracked exports and imports of organic products in the United States reached $3.4 billion in 2021. Since 2011, there has been an uptick in the total value of imported organic products, partially because more products are being tracked and partially because more high-value organic products, such as blueberries and squash, are being imported into the United States. The United States also exports organic food, and those exports have been steadily rising since 2011, reaching $0.7 billion in 2021. For example, the United States exported 2.4 thousand metric tons of organic fresh cultivated blueberries, with more than 90 percent headed to Canada in 2021. In the same year, the United States imported 41.5 thousand metric tons of organic fresh cultivated blueberries primarily from Peru (40 percent of the total imports), Chile (32 percent), and Mexico (25 percent). Importers of organic products must either be USDA-certified or belong to a trading partner with an organic recognition agreement with the United States, which allows foreign Governments to accredit certifying agents to USDA organic standards. Countries with such agreements include Canada, the European Union, Japan, South Korea, Switzerland, Taiwan, and the United Kingdom. This chart appears in the ERS topic page Organic Agriculture.
Monday, July 11, 2022
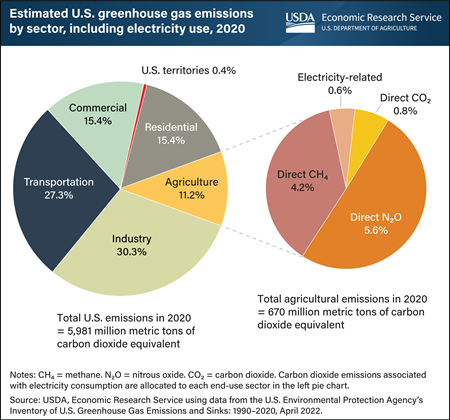
Farming activities in the United States accounted for 11.2 percent of U.S. greenhouse gas emissions in 2020. From 2019 to 2020, agricultural greenhouse gas emissions declined from 699 to 670 million metric tons of carbon dioxide equivalent but increased from 10.6 percent to 11.2 percent as a share of the U.S. economy. The Environmental Protection Agency estimated that in 2020 agriculture produced 5.6 percent as nitrous oxide (N2O), 4.2 percent as methane (CH4), 0.8 percent as on-farm carbon dioxide (CO2), and 0.6 percent emitted indirectly through the electricity that agriculture consumes. Emissions come from cropping activities that emit nitrous oxide, such as fertilizer application and manure storage and management, and enteric fermentation (a normal digestive process in animals), which produces methane. Of the economic sectors in the United States defined by the Energy Information Administration, industry (excluding agricultural emissions) accounted for the largest portion of total greenhouse gas emissions (30.3 percent), followed by transportation, residential, commercial, agriculture, and U.S. territories (no specific consumption data can be attributed within the territories, so they are listed as a group). This chart appears in the USDA, Economic Research Service data product Ag and Food Statistics: Charting the Essentials.
Monday, June 6, 2022
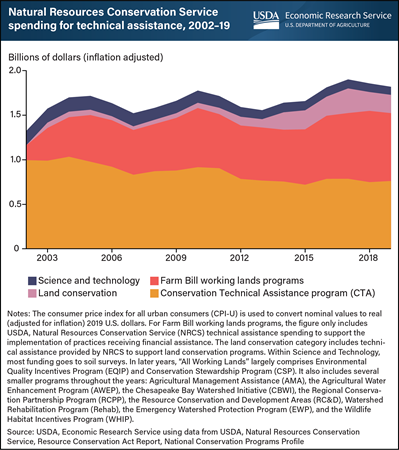
Conservation technical assistance is a service that helps producers develop skills and knowledge for maintaining the natural resources involved in agricultural production. USDA’s Natural Resources Conservation Service (NRCS) provides technical assistance through several different programs. The Conservation Technical Assistance (CTA) program provides comprehensive planning services and technical support for the adoption of conservation practices across the agricultural landscape. NRCS also provides free technical assistance to producers and landowners participating in working lands programs such as the Environmental Quality Incentives Program (EQIP) that primarily provide financial assistance for practice adoption. Similarly, NRCS provides technical support for participants in land conservation programs, which provide financial payments to producers and landowners that put land into long-term conservation, such as the Conservation Reserve Program (CRP). Finally, NRCS administers several science and technology programs, among which the largest amount of funding goes to soil surveys. Spending for the CTA program has decreased in the studied period (2002-2019) by 23 percent, once adjusted for inflation. On the other hand, spending on technical assistance in support of working lands programs that primarily provide financial assistance has increased over the period from $163 million to $761 million. Spending on technical assistance for land conservation has increased, and spending on science and technology has decreased over the same period. This chart was drawn from the USDA, Economic Research Service report USDA Conservation Technical Assistance and Within-Field Resource Concerns, published May 2022.
Wednesday, June 1, 2022
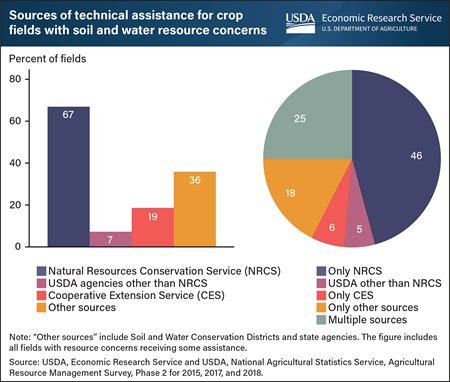
USDA asked farmers to self-report soil and water related resource concerns on their cotton, wheat, oat, and soybean fields for USDA’s 2015, 2017, and 2018 Agricultural Resource Management Survey (ARMS). USDA also asked farmers to report any sources of technical assistance which helped address their on-field soil and water concerns. USDA’s Natural Resources Conservation Service (NRCS) defines a resource concern as an expected degradation of a natural resource used in farming to the degree that its sustainability or intended use is impaired. NRCS provides free technical assistance both as a standalone service under the Conservation Technical Assistance program (CTA) and to support implementation of practices receiving financial assistance from programs such as the Environmental Quality Incentives Program (EQIP). Producers can also seek technical assistance from other USDA agencies, the Cooperative Extension System, or sources such as conservation districts or State agencies. According to recent ARMS data, about 67 percent of fields that received any technical assistance received it from NRCS, with 46 percent of assisted fields receiving assistance exclusively from NRCS. Twenty five percent of assisted fields received assistance from multiple sources. This chart was drawn from the USDA, Economic Research Service report USDA Conservation Technical Assistance and Within-Field Resource Concerns, published May 5, 2022.
Wednesday, May 25, 2022
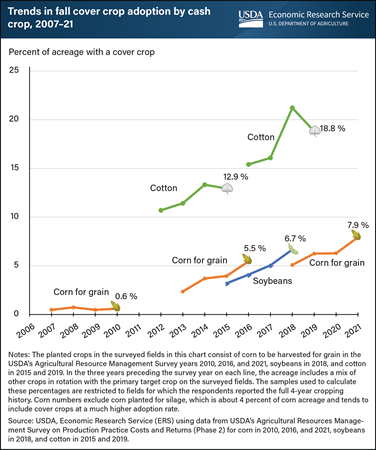
Cover crops are an increasingly popular management practice that farmers use to provide seasonal living cover between their primary commodity cash crops. Farmers often plant cover crops in the fall to provide winter cover for soil that otherwise would be bare. Over the past decade, fall cover crop adoption has grown in the United States, according to data from USDA’s Agricultural Resource Management Survey (ARMS). On fields growing corn for grain, one of the most commonly grown commodity crops, 0.6 percent of the acreage used a fall cover crop before the 2010 crop. By 2016, 5.5 percent of corn-for-grain acreage had a preceding fall cover, and by 2021, 7.9 percent of corn-for-grain acreage followed a fall cover crop. This represents a 44-percent increase in fall cover crop adoption on corn-for-grain fields between 2016 and 2021. The growth in adoption of cover crops on cotton fields is similar, with a 46-percent increase between 2015 and 2019. The ARMS surveys asked farmers to report on the cropping history, including the history of cover crop use, for each selected field. The average within-survey growth in cover crop adoption was similar for each target crop, as evident in the average year-over-year changes. A version of this chart appeared in the USDA, Economic Research Service report Cover Crop Trends, Programs, and Practices in the United States, released in February 2021. This chart adds data for 2019 cotton and 2021 corn-for-grain fields.
Friday, May 20, 2022
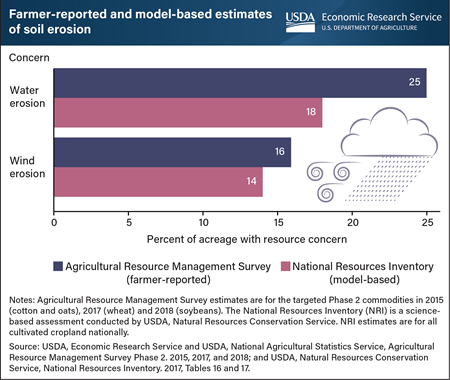
Researchers at USDA, Economic Research Service (ERS) used the USDA’s Agricultural Resource Management Survey (ARMS) to identify farmers’ concerns about soil erosion on their fields, specifically fields growing oats or cotton in 2015, wheat in 2017, and soybeans in 2018. Across all acreage represented in the selected ARMS data, farmers reported that 25 percent of acres had water-driven erosion and 16 percent had wind-driven erosion. ERS researchers compared these self-reported measures to estimates from the National Resources Inventory (NRI), a science-based assessment conducted by USDA’s Natural Resources Conservation Service. The 2017 NRI found that about 18 percent of cultivated cropland had water-driven erosion. For the NRI, a field is determined as having a problem with water-driven erosion if annual soil losses exceed its soil loss tolerance, which is the maximum rate of annual soil loss that still permits sustained economic crop production. The NRI assessment also found that about 14 percent of all cultivated cropland had more soil losses from wind-driven erosion than its soil loss tolerance. The difference in rates of erosion between the two data sources may reflect farmer perceptions about what is considered an erosion problem relative to the criteria used in the NRI. This chart can be found in the ERS report USDA Conservation Technical Assistance and Within-Field Resource Concerns, published in May 2022.
Friday, May 6, 2022
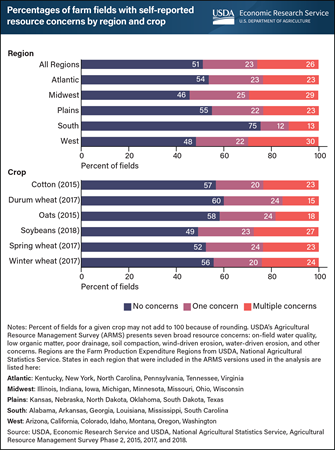
When management practices degrade a natural resource used in farming to the degree that its sustainability or intended use is impaired, then a given land unit is said to have a resource concern. The Natural Resources Conservation Service (NRCS) has identified 47 specific resource concerns affecting crop fields in the United States. ERS researchers classified the soil and water resource concerns from this list into seven broad categories in USDA’s Agricultural Resource Management Survey (ARMS). These seven broad concerns are on-field water quality, low organic matter, poor drainage, soil compaction, wind-driven erosion, water-driven erosion, and other concerns. Cotton, wheat, oat, and soybean farmers were asked to report if they were experiencing one or multiple of the seven categories of concerns on the fields surveyed by ARMS between 2015 and 2018. Overall, farmers represented across these surveys reported that 49 percent of their fields had at least one resource concern and 26 percent of their fields had two or more concerns. The percentages of fields with at least one self-reported resource concern varied by region. Resource concerns were most common in the Midwest, the largest region by the number of fields, and were least common in the South. Farmers growing soybeans reported that about 51 percent of their fields have one or multiple resource concerns. Farmers growing durum wheat, which covers 2-5 percent of the total wheat area in the country, reported one or more resource concerns on about 40 percent of fields. This chart is drawn from the USDA, Economic Research Service report “USDA Conservation Technical Assistance and Within-Field Resource Concerns,” published May 2022.
Wednesday, April 6, 2022
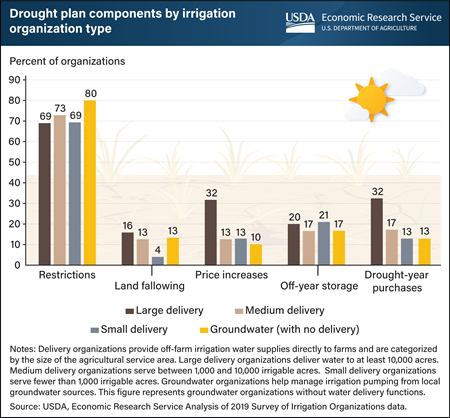
Guidelines for implementing drought-induced water restrictions on water deliveries and pumping are the most common component in the formal drought plans of irrigation organizations. In the 2019 Survey of Irrigation Organizations, USDA asked groundwater organizations and water delivery organizations, such as irrigation districts and ditch companies, questions about their formal drought planning. Around one-fifth of all organizations had a formal, written drought plan. Between 69 percent and 73 percent of water delivery organization plans and 80 percent of groundwater organization plans included details about drought-induced water restrictions as a component of their plans. Land fallowing provisions and off-year water storage strategies typically occurred in fewer than 20 percent of plans for most organizations. About one-third of large delivery organization plans included provisions for price increases and water supply augmentation during drought by purchasing additional water. This chart was drawn from the USDA, Economic Research Service report Irrigation Organizations: Drought Planning and Response (EB-33), published January 6, 2022.
Friday, March 25, 2022
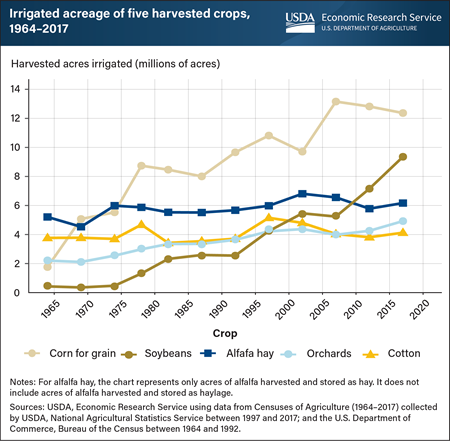
Irrigated cropping patterns have shifted significantly in the United States during the past 50 years. In 1964, alfalfa hay and cotton were the most widely irrigated crops, but acreage under those crops has stayed relatively constant since then. Meanwhile, irrigated acres planted in corn for grain and soybeans have increased substantially. In 1964, farmers planted less than 2 million acres of irrigated land in corn for grain. By 2017, irrigated acreage planted in corn grew to more than 12 million acres, making corn for grain the most commonly irrigated crop. Over the same period, irrigated acreage planted in soybeans also increased substantially, from fewer than 1 million acres to nearly 10 million acres. The growth in irrigated corn and soybean acreage reflects, in part, increasing demand for these crops as feedstock sources for bioenergy production and feed for livestock operations, both domestically and abroad. Irrigated corn and soybean expansion also reflects a broader eastward shift in irrigated production acreage over the past five decades. This chart was drawn from the USDA, Economic Research Service report “Trends in U.S. Irrigated Agriculture: Increasing Resilience Under Water Supply Scarcity,” published December 28, 2021.
Monday, March 14, 2022
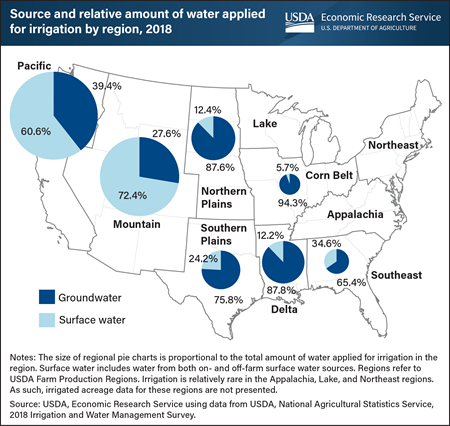
Surface and groundwater are the two primary water supply sources for irrigated agriculture. Groundwater is pumped from aquifers, while surface water is diverted from natural streams, rivers, and lakes. The predominance of surface versus groundwater use varies regionally. Groundwater is the most common source of water applied for irrigation in the Mississippi Delta, Northern Plains and Southern Plains regions. The prevalence of groundwater-fed irrigated agriculture in the Northern and Southern Plains relates to the regions’ historically abundant groundwater resources. The High Plains Aquifer, the largest aquifer in North America and also known as the Ogallala Aquifer, underlies significant portions of the Plains regions. The Mississippi Delta region also has abundant groundwater resources that are relatively shallow, making groundwater-based irrigation less expensive. Irrigated agriculture relying on surface water is most prevalent in the Mountain and Pacific regions. The extent of surface water use for irrigation in these regions reflects past Federal, State, and local investments in water conveyance and storage infrastructure, as well as characteristics of the regions’ legal institutions which grant water rights based on historical beneficial use rather than ownership of land along streams and rivers. This chart was drawn from the USDA, Economic Research Service report “Trends in U.S. Irrigated Agriculture: Increasing Resilience Under Water Supply Scarcity,” published December 28, 2021.
Wednesday, March 9, 2022
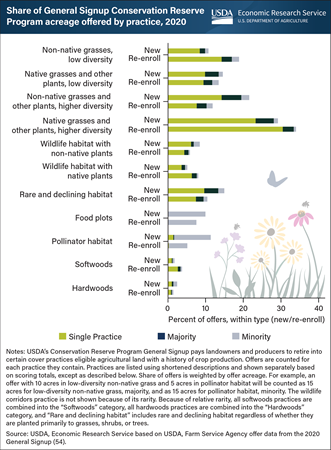
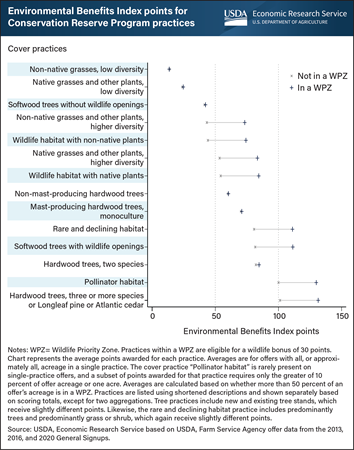
USDA’s Conservation Reserve Program (CRP) General Signup allows landowners and producers to retire eligible agricultural land with a history of crop production in exchange for payment. Landowners and producers may select one or more practices that they agree to establish for the duration of a 10- to 15-year contract, if chosen for enrollment. Practices are awarded different points based on the Environmental Benefits Index (EBI), which incorporates the expected impact of the chosen cover practice on wildlife benefits and carbon sequestration, as well as on the anticipated durability of that impact. Landowners and producers who choose a cover practice worth more points have a greater likelihood of acceptance. In 2020, more than 80 percent of re-enrolling offers and more than 90 percent of offers on land not previously enrolled in CRP chose a practice other than the lowest-scoring practice, which is non-native grasses with low diversity. The most common practice is native grasses and other plants with high diversity, which provides between 40 and 70 additional points relative to the low-diversity non-native grass practice, while only requiring the use of native species and slightly greater species richness and complexity. Grasslands practices (native and non-native grass practices) are the most common group of practices, followed by wildlife practices (wildlife and rare and declining habitat practices). Pollinator habitat is rarely the only practice on an offer. Tree practices are relatively rare. This chart is drawn from the Cover Practice Definitions and Incentives in the Conservation Reserve Program report published by USDA’s Economic Research Service, February 23, 2022.
Wednesday, March 2, 2022
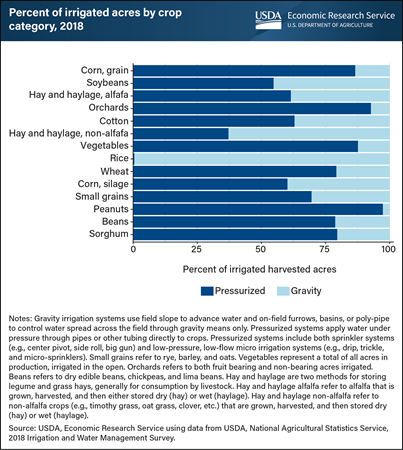
Irrigation methods vary by crop because of differences in production practices, crop value, water source, and soil characteristics. Irrigation application methods can be broadly categorized as either gravity or pressurized systems. Pressurized irrigation systems apply water under pressure through pipes or other tubing, while gravity irrigation systems use field slope to advance water across the field surface. In general, pressurized irrigation systems are more efficient than gravity irrigation systems under most field settings, as less water is lost to evaporation and seepage. Rice has the largest share of acres irrigated by gravity systems, which is related to the flooding requirements of most rice production systems in the United States. Peanuts have the largest proportion of acres irrigated by pressurized systems. Peanut cultivation is concentrated in the Southeastern United States (i.e., Alabama, Georgia, and Florida), where the prevalence of sandy, well-drained soils makes gravity irrigation methods generally unsuitable because of seepage losses. Pressurized systems are also prevalent among high-value specialty crops, such as vegetables and orchards. Pressurized irrigation systems, particularly low-flow micro irrigation systems, are generally more expensive than gravity irrigation systems, precluding their use among lower value crops. Pressurized systems are also more prominent among crops concentrated in regions more reliant on groundwater, including irrigated corn across the Eastern and Central United States. This chart was drawn from the USDA, Economic Research Service report “Trends in U.S. Irrigated Agriculture: Increasing Resilience Under Water Supply Scarcity,” published December 28, 2021.
Thursday, February 24, 2022
The Conservation Reserve Program (CRP) allows landowners and producers to enroll eligible, environmentally sensitive agricultural land in return for payments determined through long-term contracts. Most land in the program has come in through the General Signup, a competitive offer process administered by USDA, Farm Service Agency (FSA). Every offer in each General Signup is scored using the Environmental Benefits Index (EBI). “The single most important producer decision involves determining which cover practice to apply to the acres offered,” FSA says in its “EBI Fact Sheet,” which provides guidance to potential program participants. “Planting or establishing the highest scoring cover mixture is the best way to improve the chances of offer acceptance.” In a recent report, ERS analyzed the EBI points for the 11 most common practices selected in the General Signup. Cover practices that are considered higher quality, such as pollinator habitat or those using hardwood trees, earn more EBI points. Some cover practices score additional points if the land being offered for the CRP falls within a wildlife priority zone (WPZ). For practices outside of WPZs, the EBI points awarded ranged from 13 to 100. Within WPZs, the EBI points ranged higher, from 13 to 130. This chart appears in the ERS report Cover Practice Definitions and Incentives in the Conservation Reserve Program, published on February 23, 2022.
Thursday, February 17, 2022
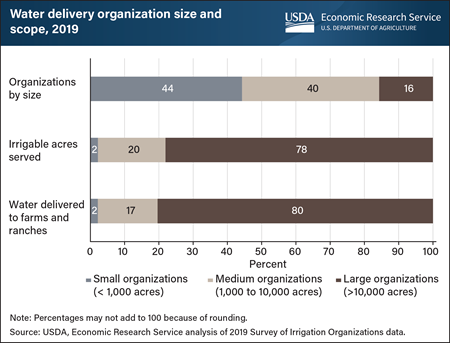
Irrigation delivery organizations, such as irrigation districts, ditch companies, mutuals and acequias, provide water to farms and ranches and can vary in size. The USDA 2019 Survey of Irrigation Organizations collected data about them in the 24 States where these organizations are most common. Analysis of the survey data indicated that most irrigation organizations are small or medium in scale based on the number of agricultural acres they serve. An estimated 44 percent serve fewer than 1,000 irrigable acres, and 40 percent serve between 1,000 and 10,000 acres. However, most land and off-farm irrigation water are supplied by large delivery organizations, which serve more than 10,000 acres. While they represent only 16 percent of organizations, they serve 78 percent of irrigated acres with off-farm water and deliver 80 percent of off-farm water. This chart appears in the ERS report Irrigation Organizations: Drought Planning and Response, release January 2022.


