ERS Charts of Note
Subscribe to get highlights from our current and past research, Monday through Friday, or see our privacy policy.
Get the latest charts via email, or on our mobile app for  and
and 
Friday, November 23, 2018
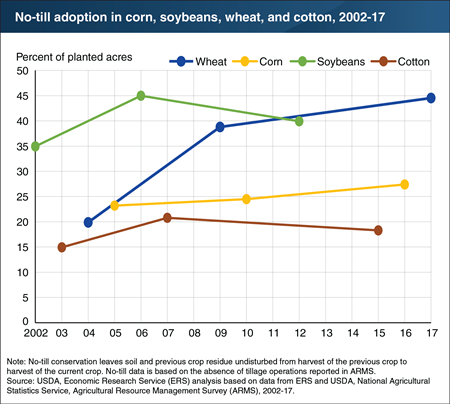
Conservation tillage reduces soil disturbance and keeps soil covered, thereby conserving soil moisture and lessening erosion. When used in conjunction with other practices, it can also help promote soil health. No-till, a type of conservation tillage where farmers plant directly into remaining crop residue without tilling, accounted for the majority of conservation tillage acreage for wheat (45 percent of total acres) in 2017 and soybeans (40 percent of total acres) in 2012. ERS researchers found that adoption of no-till, in general, increased from 2000 to 2007—particularly for wheat (2004-2009) and soybeans (2002-2006). In later periods, no-till adoption increased more slowly for wheat (2009-2017) and may have declined for soybeans (2006-2012) and cotton (2007-2015). Data for corn indicate only modest gains in adoption of no-till between 2005 and 2016. This chart appears in the ERS report, Tillage Intensity and Conservation Cropping in the United States, released in September 2018.
Friday, September 28, 2018
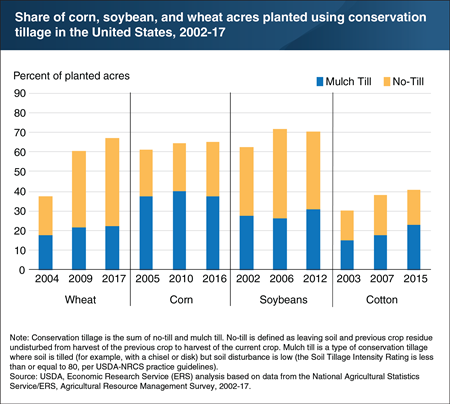
Conservation tillage helps protect soil by reducing soil disturbance and keeping the soil covered. These actions conserve soil moisture, reduce soil erosion, and, when used in conjunction with other practices, can help promote soil health. Healthy soils can improve environmental outcomes and benefit farmers. For example, greater rainfall infiltration and soil water-holding capacity can reduce runoff of sediment and nutrients while increasing drought resilience. Based on the most recent surveys, conservation tillage was used on a majority of wheat (67 percent), corn (65 percent), and soybeans (70 percent). However, conservation tillage was used on just 40 percent of cotton acres. No-till production, a type of conservation tillage where farmers plant directly into remaining crop residue without tilling, accounted for the majority of conservation tillage acres on wheat (45 percent of total acres) and soybeans (40 percent). Almost 50 percent of corn, soybean, wheat, and cotton acreage was in no-till or strip-till—a mulch till method where tillage occurs in a narrow strip where seeds are planted—at some time over a 4-year period (the survey year and 3 previous years). However, only about 20 percent of these acres were in no-till or strip-till all 4 years. This chart appears in the ERS report, Tillage Intensity and Conservation Cropping in the United States, released September 2018.
Thursday, September 27, 2018
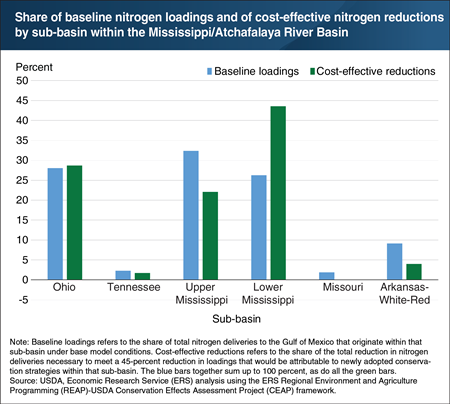
Every summer, a large area forms in the Gulf of Mexico where dissolved oxygen is too low for many aquatic species to survive. This “hypoxic zone” is fueled by nutrient (nitrogen and phosphorus) runoff from the Mississippi/Atchafalaya River Basin (MARB), a region containing about 70 percent of U.S. cropland. Recent ERS research estimated that the least-cost strategy for reducing nutrient deliveries to the Gulf from cropland in the MARB would focus a large share of the nutrient-reducing practices and cropping changes in the Lower Mississippi sub-basin. Almost half of nitrogen (44 percent) and phosphorus (46 percent) reductions under the least-cost scenario would come from the Lower Mississippi. Although the baseline analysis estimates that agriculture in the Upper Mississippi sub-basin delivers the most nitrogen to the Gulf relative to other sub-basins (over 32 percent), the Lower Mississippi sub-basin’s proximity to the Gulf means that a higher percentage of nutrient losses there reaches the Gulf than from fields farther upstream. The Lower Mississippi was estimated to have relatively high per-acre nutrient losses and deliveries to the Gulf, as well as the lowest per-pound costs of reducing nitrogen deliveries for almost all conservation practices analyzed. This chart appears in the ERS report Reducing Nutrient Losses From Cropland in the Mississippi/Atchafalaya River Basin: Cost Efficiency and Regional Distribution, released September 2018.
Wednesday, September 12, 2018
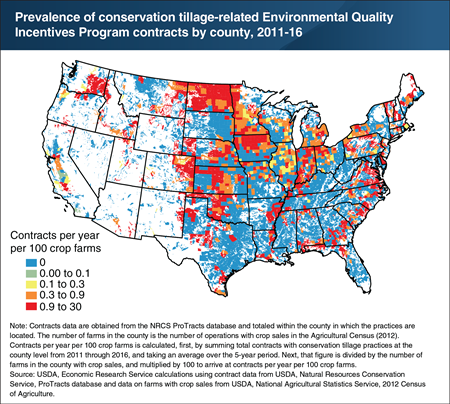
USDA offers financial assistance to farmers for implementing a wide range of conservation practices through its Environmental Quality Incentives Program (EQIP). Conservation tillage practices—including no-till, strip-till row crop planting, and mulch till—can improve soil health, reduce erosion, and reduce nutrient pollution to lakes, streams, and rivers. Farmers practicing no-till plant crops without using any sort of plow to turn residue from the prior crop into the soil. Strip tillage disturbs only the soil within the planting row, while mulch tillage minimizes soil disturbance and distributes crop residue. Between 2011 and 2016, the prevalence of EQIP contracts that included conservation tillage practices (as defined in the note) varied regionally. For example, the share was relatively high in North Dakota and northern Iowa, but much lower in neighboring counties in South Dakota. These variations may be due to underlying differences in regional adoption patterns, as well as differences in State and local funding priorities through EQIP. This chart updates data found in the April 2013 ERS report, “The Role of Conservation Programs in Drought Risk Adaptation.”
Friday, May 4, 2018
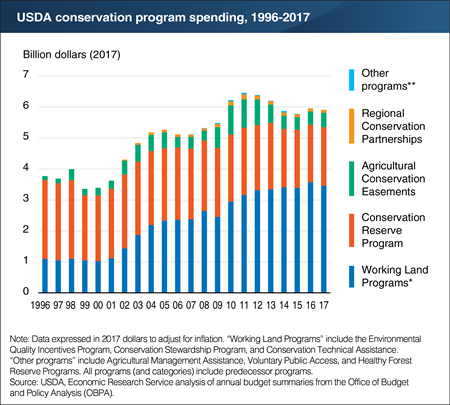
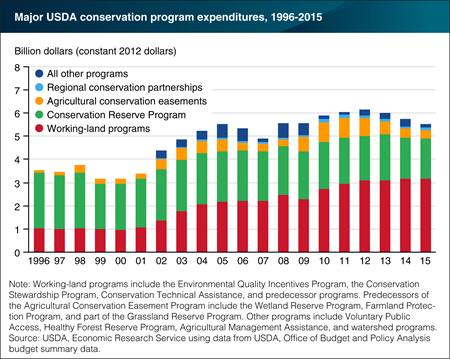
USDA agricultural conservation programs provide technical and financial assistance to farmers who adopt and maintain practices that conserve resources or enhance environmental quality. Although USDA implements more than a dozen individual conservation programs, nearly all assistance is channeled through six: the Conservation Reserve Program (CRP), Environmental Quality Incentives Program (EQIP), Conservation Stewardship Program (CSP), Conservation Technical Assistance (CTA), Agricultural Conservation Easement Program (ACEP), and the Resource Conservation Partnership Program (RCPP). EQIP, CSP, and CTA are often referred to as “Working Land Programs” because they focus primarily on supporting conservation on land in agricultural production (crops or grazing). The 2014 Farm Act continued to emphasize working land conservation. Between 2012 and 2017, combined funding for Working Land Programs accounted for more than 50 percent of spending in USDA conservation programs. This emphasis reflects a long-term trend—begun under the 2002 Farm Act—that increased annual spending in Working Land Programs. In 2017 dollars (to adjust for inflation), this spending increased from roughly $1 billion under the 1996 Farm Act to more than $3 billion under the 2014 Act. This chart updates data found in the May 2014 Amber Waves feature, "2014 Farm Act Continues Most Previous Trends In Conservation."
Monday, April 23, 2018
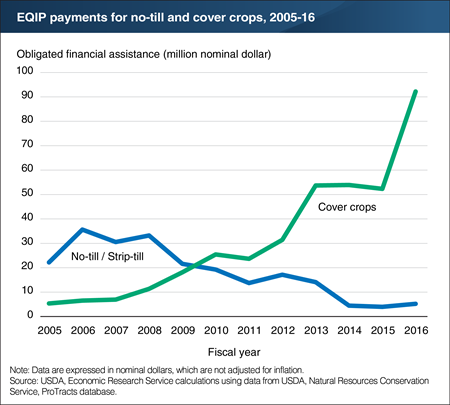
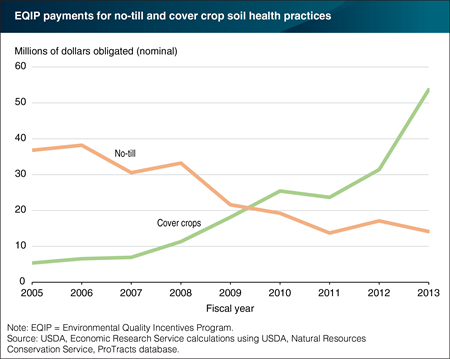
USDA offers financial assistance to farmers for implementing a wide range of conservation practices through the Environmental Quality Incentives Programs (EQIP). Two of the most popular EQIP practices for addressing soil-related resource concerns are no-till (or strip-till row crop planting) and cover crops. Farmers practicing no-till plant crops without using any sort of plow to turn residue from the prior crop into the soil. Cover crops (such as clover, field peas, and annual ryegrass) are typically grown over the winter, between plantings of commodity crops. Planting a cover crop can improve soil health, reduce erosion, and reduce nutrient pollution to lakes, streams, and rivers. Between 2005 and 2016, USDA funding for cover crops in EQIP increased from about $5 million to more than $90 million in nominal terms. Over this same period, funding for no-till declined, in part due to increasing adoption of no-till by farmers even without payment. The larger total annual obligations for cover crops in more recent years partly reflects the higher per-acre costs of implementing cover crops. This may include seed costs and the cost of removing the cover crop. This chart updates data found in the September 2016 Amber Waves feature, “An Economic Perspective on Soil Health.”
Wetland Compliance incentives are strong in Montana, North Dakota, South Dakota, Minnesota, and Iowa
Tuesday, February 27, 2018
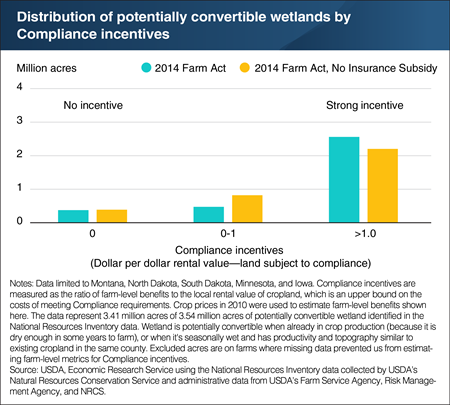
Wetlands provide a wide range of ecosystem services in all parts of the United States. For most U.S. agricultural programs, farmers who receive benefits must refrain from draining wetlands on their farm. The 2014 Farm Act re-linked crop insurance premium subsidies to this provision, known as Wetland Compliance (WC), for the first time since 1996. ERS researchers examined the effect of premium subsidies on farmer’s compliance incentives under the 2014 Farm Act. (Because of data limitations, ERS researchers focused on States that include the Prairie Pothole region: Montana, North Dakota, South Dakota, Minnesota, and Iowa, where wetland habitat is critical to ducks and other migratory birds.) In Prairie Pothole States, WC incentives are strong. When the compliance incentive includes premium subsidies, an estimated 75 percent (2.6 million acres) of potentially convertible wetland is on farms where Compliance incentives (farm program benefits) are clearly large enough to offset revenue lost by not draining these lands for crop production. Severing the link between WC and crop insurance premium subsidies (while continuing the link between Compliance and other 2014 Farm Act programs) would reduce the number of potentially convertible wetlands with strong protection by 15 percent (from 2.6 to 2.2 million acres). This chart appears in the July 2017 report, Conservation Compliance: How Farmer Incentives Are Changing in the Crop Insurance Era.
Wednesday, November 1, 2017
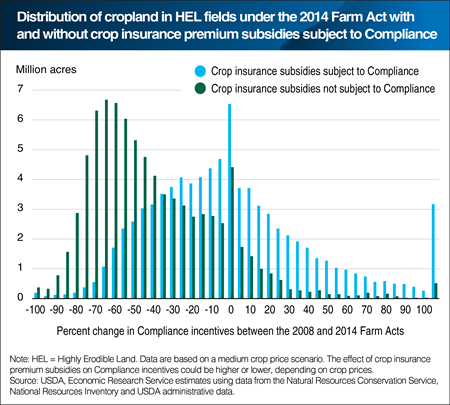
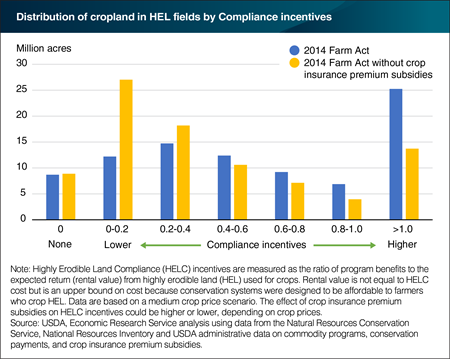
To be eligible for most U.S. farm program benefits, participating farmers must apply soil conservation systems on cropland that is particularly vulnerable to soil erosion. The 2014 Farm Act re-linked crop insurance premium subsidies to this provision, known as Highly Erodible Land Compliance (HELC), for the first time since 1996. These premium subsidies account for a significant share of Compliance incentives—typically between 30 and 40 percent, depending on crop prices. The 2014 Act also included major changes in other Compliance-linked programs, including the elimination of Direct Payments, a large program under the 2008 Farm Act. On individual farms, Compliance-linked benefits could be higher or lower than they would have been under a continuation of the 2008 Act. Under the 2014 Act (blue bars), ERS researchers estimated that less than 10 million acres are on farms that would have experienced a 50-percent or larger decline in Compliance incentives between the two Farm Acts given crop prices similar to 2010 levels. If premium subsidies were not subject to Compliance (green bars), more than 40 million acres of cropland in HEL fields would be on farms where Compliance incentives would decline by 50 percent or more. This chart appears in the July 2017 Amber Waves feature, "Conservation Compliance in the Crop Insurance Era."
Tuesday, October 3, 2017
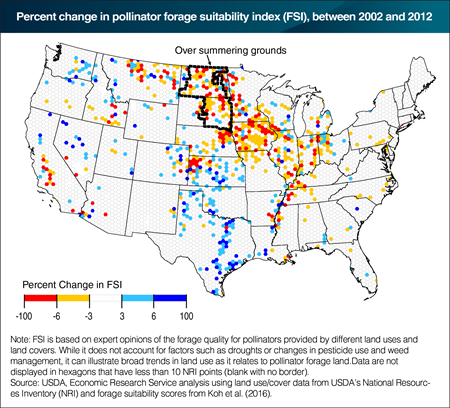
About one-third of the world’s food crops depend on pollinators like bees. Managed honeybees in the United States alone provide over $350 million worth of pollination services each year. Pollinators rely on the land to provide forage, the pollen and nectar of flowering plants that pollinators feed on to survive. If forage is inadequate, pollinator health may be poor. ERS developed a forage suitability index (FSI) to examine how broad trends in land use have affected the availability of forage for pollinators. Findings show the national average FSI increased by about 2 percent from 1982 to 2002, due in part to the introduction of USDA’s Conservation Reserve Program (CRP) in 1986. The mix of species farmers agree to plant on CRP land often improves pollinator forage. However, the national average FSI plateaued between 2002 and 2012. The FSI had a greater-than-average decline in North Dakota and South Dakota—the summer foraging grounds for many managed honeybee colonies. Decreases in CRP acreage and increases in soybean acreage, which provide poor forage for pollinators, helped drive this decline. This chart appears in the July 2017 Amber Waves finding, "Declines in Pollinator Forage Suitability Were Concentrated in the Midwest, the Over-Summering Grounds for Many Honeybees."
Friday, September 15, 2017
Most U.S. agricultural programs that provide payments to farmers require participating farmers to apply soil conservation systems on cropland that is particularly vulnerable to soil erosion. ERS research shows that this provision, Highly Erodible Land Compliance (HELC), is effective in reducing soil erosion when the farm program benefits that could be lost due to noncompliance exceed the cost of meeting conservation requirements. Under the 2014 Farm Act, some programs previously linked to HELC were eliminated, while new ones were created. In addition, crop insurance premium subsidies were re-linked to HELC for first time since 1996. Twenty-five million acres of highly erodible cropland are estimated to be in farms with relatively strong Compliance incentives (rightmost bars) under the Act. Without premium subsidies, farms with this level of HELC incentive would include only 14 million acres of highly erodible cropland. By comparison, farms with relatively weak Compliance incentives (the second and third sets of bars) include an estimated 27 million acres of highly erodible cropland. Without premium subsidies, farms with this level of HELC incentive would include an estimated 45 million acres of highly erodible cropland. A version of this chart appears in the ERS report, Conservation Compliance: How Farmer Incentives Are Changing in the Crop Insurance Era, released July 2017.
Monday, August 7, 2017
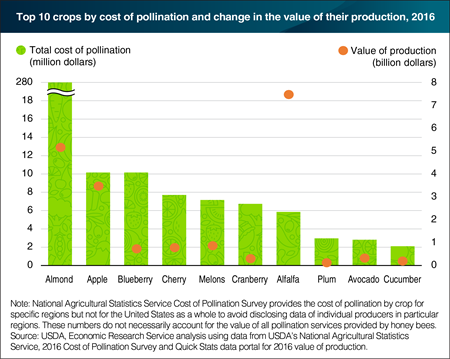
Farmers growing crops that depend on pollination can rely on wild pollinators in the area or pay beekeepers to provide honeybees or other managed bees, such as the blue orchard bee. In 2016, U.S. farmers paid $354 million for pollination services. Producers of almonds alone accounted for 80 percent of that amount—over $280 million. By comparison, producers of apples and blueberries paid about $10 million each. Pollination services helped support the production of these crops—which, in 2016, had a total production value of about $5.2 billion for almonds, $3.5 billion for apples, and $720 million for blueberries. Between 2007 and 2016, the production value of almonds grew by 85 percent in real terms, while the production value of both apples and blueberries grew by about 15 percent. Over the same period, the number of honey-producing colonies grew by 14 percent. This chart uses data found in the ERS report Land Use, Land Cover, and Pollinator Health: A Review and Trend Analysis, released June 2017.
Friday, July 28, 2017
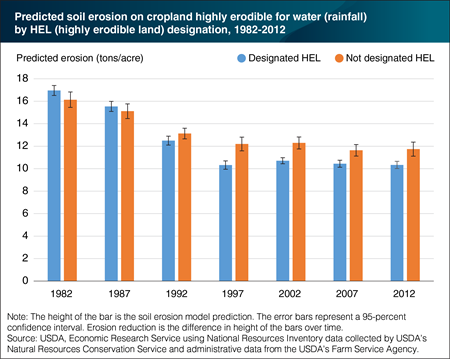
Conservation Compliance ties eligibility for most Federal farm program benefits to soil and wetland conservation requirements. Under Highly Erodible Land Conservation (HELC), for example, farmers who grow crops in fields designated as highly erodible land (HEL) must apply an approved conservation system—one or more practices that work together to reduce soil erosion. ERS researchers used a statistical model to compare water (rainfall) erosion on cropland in HEL fields to similar cropland not in HEL fields. Between 1982 and 1997, soil erosion reductions were significantly larger in HEL fields (39 percent, or 6.6 tons per acre) than in those not designated as HEL fields (24 percent, or 3.9 tons per acre). The difference—about 2.7 tons per acre—is statistically different from zero, suggesting that HELC did make a significant difference in soil erosion reduction. During 1997-2012, after the initial implementation of HELC was complete, ERS analysis finds that these soil conservation gains were maintained. This chart appears in the July 2017 Amber Waves feature, "Conservation Compliance in the Crop Insurance Era."
Tuesday, October 25, 2016
Farmers can receive Federal financial assistance for implementing a wide range of conservation practices from the Natural Resources Conservation Service’s Environmental Quality Incentives Program (EQIP). Adopting no-till and planting cover crops are two common agricultural practices that can improve soil health. Farmers receiving payments for no-till agree to plant crops without using any sort of plow to turn residue from the prior crop into the soil. Those receiving payments for cover crops plant certain crops (such as clover, field peas, and annual ryegrass) or a mixture of crops to maintain cover and add organic matter. Cover crops are usually grown over the winter, between plantings of commodity crops. From 2005 to 2013, USDA funding for cover crops in EQIP increased ten-fold—from about $5 million to more than $50 million in nominal terms. Over this same period, funding for no-till adoption declined. This shift in focus can be attributed to a variety of factors, such as increasing adoption of no-till by farmers even without payment and improving availability of cover crop seeds and educational materials. This chart appears in the September 2016 Amber Waves feature, “An Economic Perspective on Soil Health.”
Friday, September 30, 2016
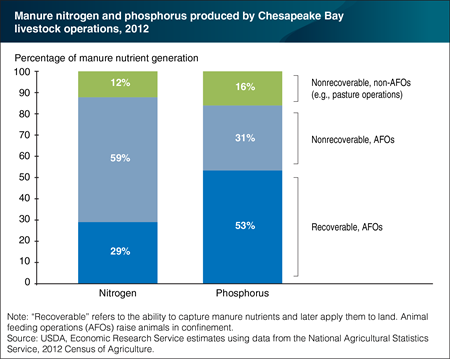
In 2010, to help meet water quality goals, the U.S. Environmental Protection Agency (EPA) adopted a limit on the amount of pollutants that the Chesapeake Bay can receive. Nitrogen and phosphorus, in particular, can lead to adverse effects on public health, recreation, and ecosystems when present in excess amounts. The EPA estimates that applications of manure contribute 15 percent of nitrogen and 37 percent of phosphorus loadings to the Bay. Furthermore, ERS estimates that animal feeding operations (AFOs), which raise animals in confinement, account for 88 percent of manure nitrogen and 84 percent of manure phosphorus generation in that watershed. ERS also estimates that about a third of nitrogen and half of phosphorus produced at AFOs can be recovered for later use. That adds to about 234 million pounds of nitrogen and 106 million pounds of phosphorus recovered. These nutrients can then be redistributed regionally to fertilize agricultural land, thereby lessening nutrient run-off problems in the Bay. The remaining nutrients cannot be recovered. Both nitrogen and phosphorus may be lost during collection, storage, and transportation; nitrogen may also volatize into the atmosphere. This chart is based on the ERS report Comparing Participation in Nutrient Trading by Livestock Operations to Crop Producers in the Chesapeake Bay Watershed, released in September 2016.
Wednesday, September 21, 2016
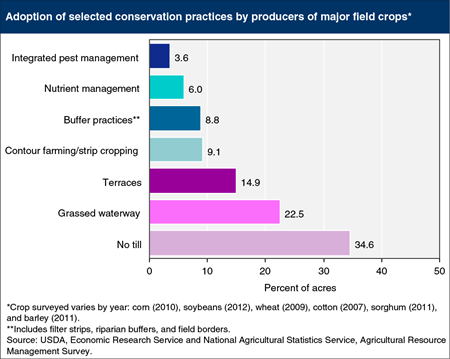
The environmental effects of agricultural production, e.g., soil erosion and the loss of sediment, nutrients, and pesticides to water, can be mitigated using conservation practices. Some practices are more widely adopted than other practices; no conservation practice has been universally adopted by U.S. farmers. Variation in conservation practice adoption is due, at least in part, to variation in soil, climate, topography, crop/livestock mix, producer management skills, and financial risk aversion. These factors affect the onfarm cost and benefit of practice adoption. Presumably, farmers will adopt conservation practices only when the benefits exceed cost. Government programs can increase adoption rates by helping defray costs. The potential environmental gain also varies—ecosystem service benefits (such as improved water quality and enhanced wildlife habitat) depend both on the practice and on the location and physical characteristics of the land. This chart is based on data from ARMS Farm Financial and Crop Production Practices.
Tuesday, May 31, 2016
USDA relies mainly on voluntary programs providing financial and technical support to encourage farmers to conserve natural resources and protect the environment. In inflation adjusted terms, USDA conservation program expenditures increased by roughly 70 percent between 1996 and 2012. Much of the increases in real spending over this period occurred in working land programs and agricultural easements. Working land programs provide assistance to farmers who install or maintain conservation practices (such as nutrient management, conservation tillage, and the use of field-edge filter strips) on land in crop production and grazing. Agricultural easements provide long-term protection for agricultural land and wetlands. The Conservation Reserve Program—which pays farmers to remove environmentally sensitive land from production and encourages partial-field practices such as using grass waterways and riparian buffers—is still USDA’s largest conservation program, but has slowly ebbed in prominence. While real spending on USDA conservation programs rose under the 2002 Farm Act (2002-07) and the 2008 Farm Act (2008-13), the 2014 Farm Act reduced mandatory spending, and expenditures over 2014 and 2015 appear to be leveling off. This chart is found in the Ag and Food Statistics: Charting the Essentials data product on the ERS website.
Friday, April 22, 2016
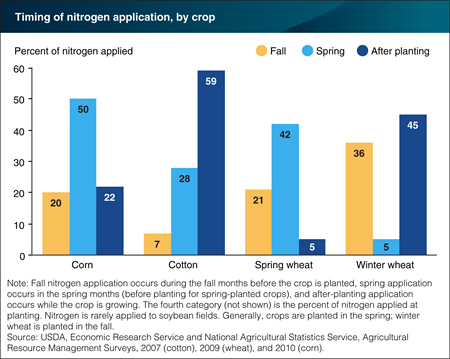
Efficient nitrogen fertilizer applications closely coincide with plant needs to reduce the likelihood that nutrients are lost to the environment before they can be taken up by the crop. Fall nitrogen application occurs during the fall months before the crop is planted, spring application occurs in the spring months (before planting for spring-planted crops), and after-planting application occurs while the crop is growing. The most appropriate timing of nitrogen applications depends on the nutrient needs of the crop being grown. In general, applying nitrogen in the fall for a spring-planted crop leaves nitrogen vulnerable to runoff over a long period of time. Applying nitrogen after the crop is already growing, when nitrogen needs are highest, generally minimizes vulnerability to runoff and leaching. Cotton farmers applied a majority of nitrogen—59 percent—after planting. Winter wheat producers applied 45 percent of nitrogen after planting. Corn farmers applied 22 percent of nitrogen after planting, while spring wheat farmers applied 5 percent after planting. Farmers applied a significant share of nitrogen in the fall for corn (20 percent) and spring wheat (21 percent). Fall nitrogen application is high for winter wheat because it is planted in the fall. This chart is found in the ERS report, Conservation-Practice Adoption Rates Vary Widely by Crop and Region, December 2015.
Tuesday, March 1, 2016
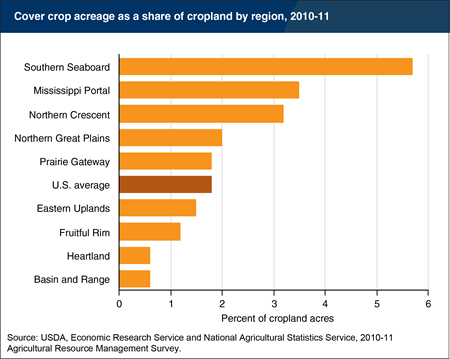
Cover crops are thought to play a role in improving soil health by keeping the soil “covered” when an economic crop is not growing. Cover crops reduce soil erosion, trap nitrogen and other nutrients, increase biomass, reduce weeds, loosen soil to reduce compaction, and improve water infiltration to store more rainfall. The 2010-11 Agricultural Resource Management Survey was the first USDA survey to ask respondents to report cover crop use (findings from the 2012 Agricultural Census—the most recent available—are similar). Approximately 4 percent of farmers adopted cover crops on some portion of their fields, accounting for 1.7 percent of total U.S. cropland (6.8 million acres) in 2010-11. Cover crop adoption was highest in the Southern Seaboard (5.7 percent) and lowest in the Heartland and Basin and Range (0.6 percent each). This distribution is likely due to the fact that cover crops are easiest to establish in warmer areas with longer growing seasons. Limited cover crop use overall, however, suggests that the benefits of cover crop adoption are being realized on few acres. This chart is from the ERS report, Conservation-Practice Adoption Rates Vary Widely by Crop and Region, December 2015.
Thursday, June 25, 2015
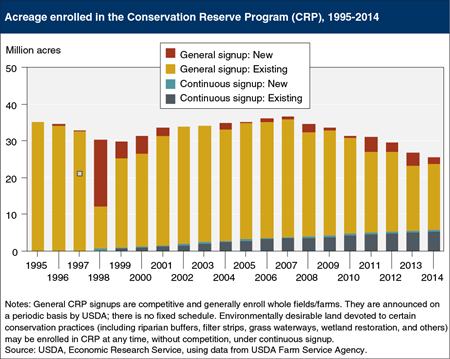
The Agricultural Act of 2014 gradually reduces the cap on land enrolled in the Conservation Reserve Program (CRP) from 32 million acres to 24 million acres by 2017. CRP acreage declined 34 percent since 2007, falling from 36.8 million acres to 24.2 million by April 2015. Environmental benefits may not be diminishing as quickly as the drop in enrolled acreage might suggest. While initially enrolling mainly whole fields or farms (through periodically announced general signups), CRP increasingly uses “continuous signup” (which has stricter eligibility requirements than general signup) to enroll high-priority parcels that often provide greater per-acre environmental benefits. Conservation practices on these acres include riparian buffers, filter strips, grassed waterways, and wetland restoration. Riparian buffers, for example, are vegetated areas that help shade and partially protect a stream from the impact of adjacent land uses by intercepting nutrients and other materials, and provide habitat and wildlife corridors. Enrollment under continuous signup increased by about 50 percent, from 3.8 million acres in 2007 to 5.7 million acres in 2014. A version of this chart is found on the ERS web page, Agricultural Act of 2014: Highlights and Implications (Conservation).
Monday, June 1, 2015
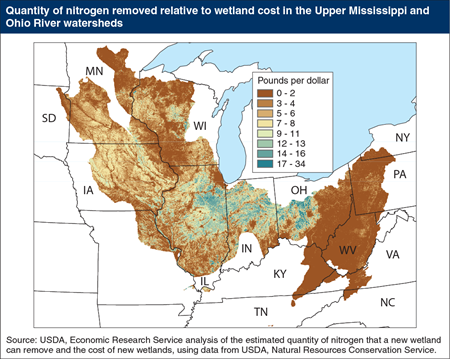
Every year, agriculture contributes an estimated 60-80 percent of delivered nitrogen and 49-60 percent of delivered phosphorous in the Gulf of Mexico. Nitrogen in waters can cause rapid and dense growth of algae and aquatic plants, leading to degradation in water quality as found in the hypoxic zone of the Gulf of Mexico, where excess nutrients have depleted oxygen needed to support marine life. Nitrogen removal is one of the many benefits of wetlands. An ERS analysis found that on an annual basis, the amount of nitrogen removed per dollar spent to restore and preserve a new wetland ranged from 0.15 to 34 pounds within the area of study (the Upper Mississippi/Ohio River watershed), or a range of $0.03 to $7.00 per pound of nitrogen removed. Restoring and protecting wetlands in the very productive corn-producing areas of Illinois, Indiana, and Ohio tends to be more cost effective than elsewhere in the study area. The study suggests that if nitrogen reduction was the only environmental goal, these corn-producing areas would be a good place to restore wetlands. Hydrologic conditions in the Upper Mississippi and Ohio River watersheds are unique, so the cost effectiveness of wetlands elsewhere is uncertain. This map is found in the ERS report, Targeting Investments To Cost Effectively Restore and Protect Wetland Ecosystems: Some Economic Insights, ERR-183, February 2015.


