ERS Charts of Note
Subscribe to get highlights from our current and past research, Monday through Friday, or see our privacy policy.
Get the latest charts via email, or on our mobile app for  and
and 
_450px.png?v=8478.2)
Friday, June 2, 2017
USDA’s Food Safety and Inspection Service (FSIS) tests chicken and turkey carcasses as well as ground meats and poultry and chicken parts for non-typhoidal Salmonella in meat and poultry plants. Until 2008, plant performance on these tests was not disclosed to the public. In 2006, FSIS enacted an easy-to-understand metric for rating a chicken plant’s performance on Salmonella tests, and from 2008 to 2010, disclosed the identities of plants with mediocre or poor performance on the agency’s Web site. In 2011, FSIS established a stricter performance standard for chicken plants. A recent ERS report explored the impact of FSIS’s efforts to provide better and more information on chicken plants’ performance on Salmonella tests and the impact of the 2011 revision to the Salmonella performance standard for chicken. The researchers accounted for plant-level factors, such as the size and age of the plant, to isolate the effect of the policy changes on Salmonella levels. During 2006-14, the share of samples of broilers testing positive for Salmonella dropped from about 14 to 2 percent. ERS analysis found that 75 percent of the decline correlated with the timing of FSIS’s disclosure policy and the 2011 standard. This chart appears in the ERS report, Public Disclosure of Tests for Salmonella: The Effects on Food Safety Performance in Chicken Slaughter Establishments, and the Amber Waves article, "Regulation, Market Signals, and the Provision of Food Safety in Meat and Poultry," released on May 26, 2017.
Friday, August 5, 2016
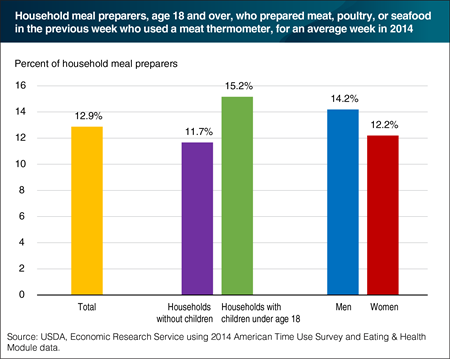
The 2014 ERS Eating & Health Module of the American Time Use Survey features new questions about food safety practices when preparing meals. This is the first nationally-representative, large scale Federal survey to ask Americans about their use of meat thermometers when preparing meat, poultry, or seafood. Survey respondents who said that they are the usual meal preparers or those who split the task with other household members were asked whether they had prepared any meals with meat, poultry, or seafood in the last week. Eighty-nine percent of the usual/split meal preparers prepared some form of meat. Of those, 12.9 percent used a meat thermometer in preparing meals. Meal preparers in households with children had a higher rate of meat thermometer usage (15.2 percent) than in households without children (11.7 percent). The shares of men and women meal preparers who used a meat thermometer—14.2 and 12.2 percent, respectively—were not statistically different from each other. The data for this chart are from the ERS report, Americans’ Eating Patterns and Time Spent on Food: The 2014 Eating & Health Module Data, released on July 28, 2016.
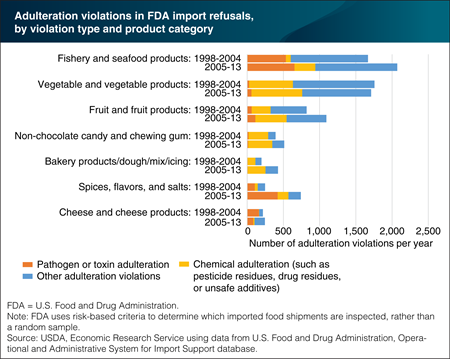
Adulteration violations in imported foods increased the most for spices, flavors, salts, and seafood
Friday, July 8, 2016
The U.S. Food and Drug Administration (FDA) oversees the safety of most food sold in the United States. Part of this oversight includes inspecting imported foods at the border or port of entry for evidence of adulteration or misbranding. FDA uses risk-based criteria to determine which shipments are inspected, rather than a random sample. A recent ERS study examined patterns in FDA import refusals over 2005-2013 and compared results with an earlier study of data from 1998-2004. Compared with the earlier period, spices, flavors, and salts, as well as fishery and seafood products, had the largest increases in the number of violations per year for adulteration—problems relating to safety issues, packaging integrity, or sanitation. In fishery and seafood products, the most common adulteration violations were for filth (visually apparent non-food material), the presence of Salmonella bacteria, and veterinary drug residues. In spices, flavors, and salts, the most common violation was for Salmonella. This chart is from “Patterns in FDA Imported Food Refusals Highlight Most Frequently Detected Problems” in ERS’s Amber Waves magazine, March 2016.
Monday, June 13, 2016
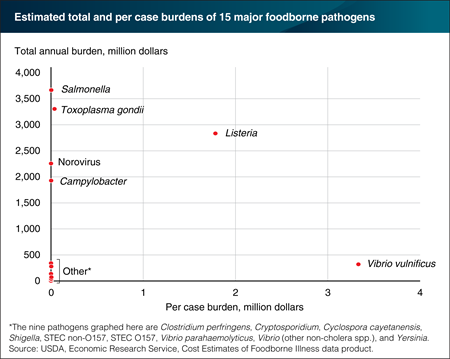
Both the total economic burden of a disease and the severity of individual cases are important indicators of how serious the disease is. ERS estimates the aggregate economic burden of 15 major foodborne illnesses at over $15 billion per year. But these 15 illnesses—and the pathogens that cause them—have very different total and per case impacts. For example, Salmonella’s total annual economic burden ($3.7 billion) is over 10 times Vibrio vulnificus’s ($320 million). But the per case burden of Vibrio vulnificus ($3.3 million) is almost 1,000 times that of a Salmonella case ($3,568). High per case burdens are the result of severe health outcomes, such as birth defects, renal failure, and death. Total annual economic burden reflects per case costs and how many people are sickened by the pathogens each year. Toxoplasma gondii ranks second behind Salmonella in terms of total economic burden and has a per case cost of $38,114. Listeria ranks high on both a per case basis ($1.8 million) and a total annual burden basis ($2.8 billion). Like Salmonella, Norovirus and Campylobacter also stand out as having high total impacts, though relatively lower per case costs. The statistics for this table are from ERS’s Cost Estimates of Foodborne Illnesses data product, March 2016.
Thursday, March 31, 2016
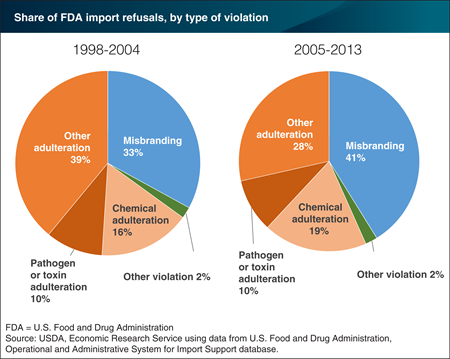
The U.S. Food and Drug Administration (FDA) is responsible for overseeing the safety of most food sold in the United States, including food imported from other countries. A recent ERS study examined patterns in FDA import refusals over 2005-13 and compared results with an earlier study of data from 1998-2004. In both time periods, the majority of violations were for adulteration—problems relating to poisonous ingredients, disease-causing bacteria and viruses (pathogens), unsafe color additives, pesticide residues, or filth (visually apparent non-food material). Two product groups—fishery/seafood products and spices/flavors/salts—were responsible for the majority of violations for Salmonella bacteria. Chemical adulteration, including pesticide residues, accounted for a slightly larger share of import refusals in 2005-13. Chemical adulteration is a common type of adulteration violation in fresh produce and fruit and vegetable products. Misbranding violations for false, misleading, or missing labels accounted for 41 percent of violations in 2005-13, up from 33 percent in 1998-2004. The data for this chart come from the ERS report, FDA Refusals of Imported Food Products by Country and Category, 2005–2013, released on March 28, 2016.
Thursday, December 3, 2015
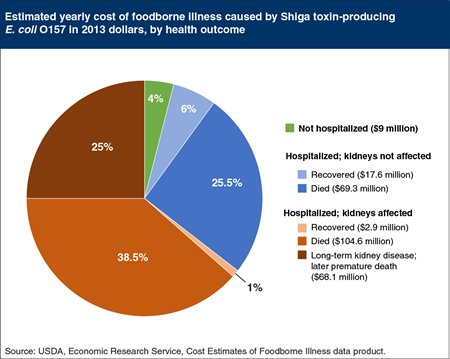
While most E. coli bacteria are relatively harmless, a small group of E. coli produce a Shiga toxin that can severely damage a person’s kidneys. The most well-known Shiga toxin-producing E. coli (STEC), STEC O157, causes less than 1 percent of U.S. foodborne illnesses with an identifiable pathogen cause and only 2 percent of the cost of these pathogens. Yet, because it is a major cause of outbreaks and because it can cause kidney damage, STEC O157 is often in the news. ERS estimates that the 63,000 illnesses caused by STEC O157 (formerly called E. coli O157) each year in the United States impose $271.4 million in economic burden. Most people (97 percent) sickened with STEC O157 recover without being hospitalized. In roughly 2,100 cases of STEC O157 illnesses, however, people are hospitalized; in 15 percent of these cases the kidneys are affected—sometimes resulting in death, ongoing dialysis, or a kidney transplant. Cases in which the kidneys are affected account for 64.5 percent of the economic burden from foodborne STEC O157. This chart is based on a chart in the ERS report, Economic Burden of Major Foodborne Illnesses Acquired in the United States, May 2015.
Thursday, October 29, 2015
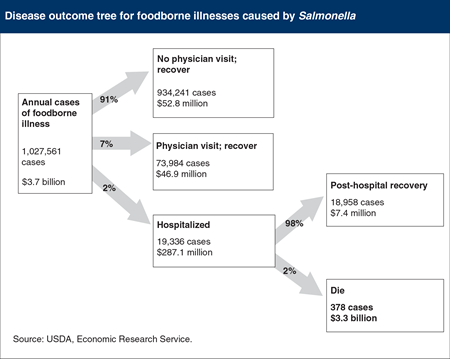
Quantifying the impacts of foodborne illness can help public health officials and food industry personnel better target food safety resources. ERS has analyzed the economic burden of the 15 pathogens responsible for close to 95 percent of the 9.4 million annual episodes of foodborne illness for which a pathogen cause can be identified. ERS estimates reveal that 83 percent of the economic burden from these 15 foodborne pathogens is due to the number of deaths they cause per year. For example, of the 1 million annual cases of foodborne illness caused by the pathogen Salmonella, an average of 91 percent of people recovered without visiting a doctor, 7 percent visited a doctor and recovered, and 2 percent of cases were severe enough to require hospitalization. Most people hospitalized with a Salmonella infection recover. However, the 378 people who do not survive account for $3.3 billion, or 89 percent, of the economic burden from this pathogen. This chart appears in “Quantifying the Impacts of Foodborne Illnesses” in the September 2015 issue of ERS’s Amber Waves magazine.
Thursday, September 10, 2015
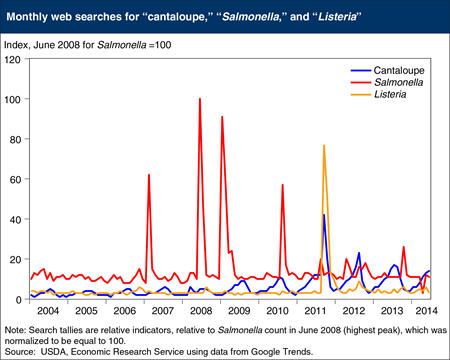
Evidence from Internet searches suggests that many consumers actively seek information about foodborne pathogens in response to warnings from Federal health and safety officials. For example, searches using the term “Salmonella” display four large spikes, coincident with FDA’s February 2007 warnings about peanut butter products, the June 2008 warning to avoid tomatoes and other raw vegetables, regulatory actions taken in January and February 2009 regarding peanut butter, and FDA’s August 2010 egg recall. A recent ERS case study concludes that consumers can distinguish between different foodborne risks. In 2011 and 2012, consumers were warned away from cantaloupes because of bacterial contamination that could cause foodborne illness. The first recall was due to Listeria monocytogenes—a pathogen responsible for an often fatal illness when afflicting the elderly—and the second from two Salmonella serotypes, less lethal but more common. Consumers sought greater information on the more dangerous risk caused by a lesser known pathogen (Listeria) compared with the 2012 Salmonella-related recall. Cantaloupe queries spiked in September 2011 along with Listeria searches—a term not often searched during 2004-2014, except for September 2011 and several months following. Salmonella searches in response to FDA’s 2012 warnings were less numerous. This chart appears in the ERS report, How Much Does It Matter How Sick You Get? Consumers’ Response to Foodborne Disease Outbreaks of Different Severities, released on August 27, 2015.
Thursday, July 9, 2015
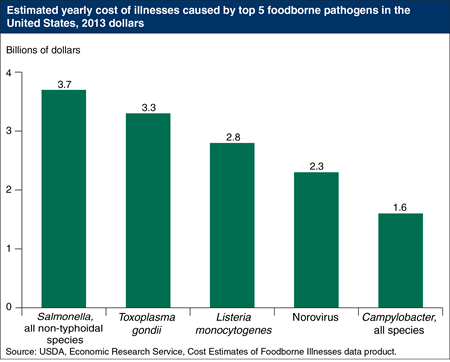
In a typical year, 15 pathogens cause over 95 percent of the 9.4 million cases of foodborne illness in the United States for which a pathogen cause can be identified. ERS estimates that these 15 pathogens impose $15.5 billion per year in medical costs, wages lost from time away from work, and societal willingness to prevent premature deaths. Just five pathogens—Salmonella (all non-typhoidal species), Toxoplasma gondii, Listeria monocytogenes, Norovirus, and Campylobacter—account for 90 percent of this economic burden. A foodborne pathogen’s economic burden is determined by both the number and severity of illnesses it causes. Norovirus is the most common U.S. foodborne illness, but one from which 90 percent of infected people recover without seeking medical care. In contrast, Listeria monocytogenes sickens a relatively small number of Americans each year, but almost 20 percent of those infected die. The statistics for this chart are from the ERS report, Economic Burden of Major Foodborne Illnesses Acquired in the United States, May 2015.
Wednesday, May 13, 2015
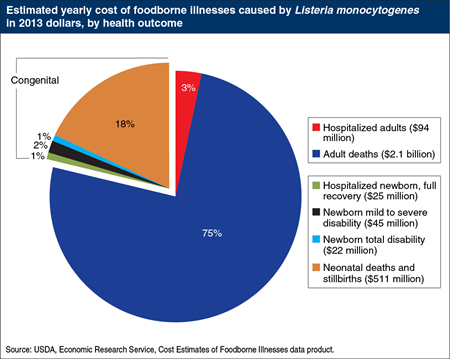
Listeria monocytogenes causes few illnesses compared to many other major U.S. foodborne pathogens, but these few cases have a high economic burden. According to 2011 estimates from the U.S. Centers for Disease Control and Prevention, each year about 1,300 adults in the United States are sickened by foodborne Listeria. These cases can have serious consequences, especially for older adults, those with compromised immune systems, and pregnant women and their unborn children. Ninety percent of those who are sickened by Listeria require hospitalization and around 250 die. Pregnant women generally recover without further complications to themselves, but their infections can have serious impacts on their fetuses. Each year, about a third of the 280 cases of congenitally-acquired Listeria infections result in permanent disability or death. ERS estimates that foodborne Listeria infections cause an estimated $2.8 billion annually in medical costs, lost wages, and societal willingness to pay to prevent deaths. About a quarter of that burden is from newborn and prenatal infections. This chart and similar charts for 14 other pathogens can be found in the ERS report, Economic Burden of Major Foodborne Illnesses Acquired in the United States, released on May 12, 2015.
Friday, February 27, 2015
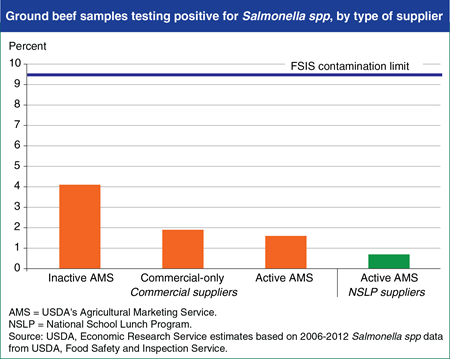
USDA’s Agricultural Marketing Service (AMS) provides about half of the ground beef served in the National School Lunch Program (NSLP) by purchasing raw and cooked ground beef products from U.S. meat producers. AMS-approved suppliers must meet AMS’s basic standards. AMS suppliers can be “active” and sell to the NSLP or be “inactive” and sell in commercial markets only. Active ground beef suppliers must adhere to a strict Salmonella standard. A recent ERS study found that on average, ground beef from all groups of producers examined had levels of Salmonella below the limit set by USDA’s Food Safety and Inspection Service. Researchers also found that AMS standards incentivize producers to supply ground beef to the NSLP that has lower levels of Salmonella contamination (0.7 percent of samples testing positive) than the ground beef the same suppliers sell to commercial buyers (1.6 percent of samples testing positive). Plants supplying ground beef to the NSLP performed better on Salmonella tests than commercial-only and inactive AMS plants. This chart appears in “Strict Standards Nearly Eliminate Salmonella From Ground Beef Supplied to Schools” in the February 2015 issue of ERS’s Amber Waves magazine.
Monday, January 26, 2015
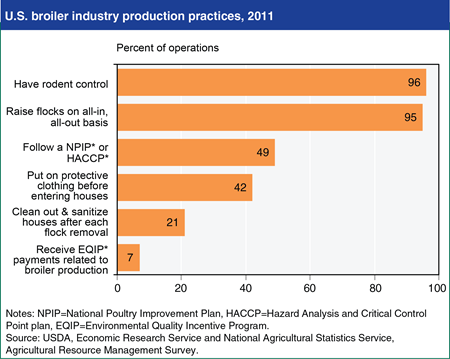
USDA’s National Agricultural Statistics Service and Economic Research Service recently conducted the Agricultural Resource Management Survey (ARMS) of the U.S. broiler chicken industry. Results indicate that several sanitation and biosecurity practices were widespread on broiler operations in the United States in 2011. Almost all operations used practices to control rodent and wild bird access to facilities, and almost all rotated flocks on an all-in, all-out basis, aimed at limiting the spread of pathogens and disease among animals. Nearly half of broiler operations reported that they follow the National Poultry Improvement Plan (NPIP) or a Hazard Analysis and Critical Control Point (HACCP) Plan, which are designed to improve animal health, food safety, and food quality. One-fifth of operations fully cleaned out and sanitized their houses after each flock removal. USDA may provide support for incineration and composting facilities, as well as litter management practices, through payments made under the Environmental Quality Incentive Program (EQIP). ARMS results find that seven percent of contract growers received EQIP payments related to broiler production in 2011. This chart is found in the ERS/NASS report, 2011 ARMS - Broiler Industry Highlights.
Monday, January 5, 2015
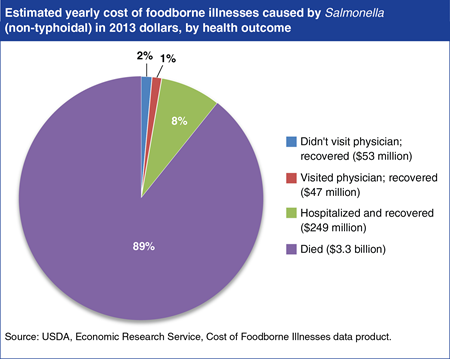
Each year, roughly a million people in the United States become ill from a foodborne Salmonella infection according to 2011 estimates from the U.S. Centers for Disease Control and Prevention. For most healthy people, the infection causes short-lived symptoms that do not require medical attention. However, 7 percent of those infected are sick enough to visit a physician before recovering. Over 19,000 people a year are admitted to the hospital with a foodborne Salmonella infection, and roughly 380 of them die. Salmonella ranks first among 15 leading U.S. foodborne pathogens in terms of economic burden. Foodborne Salmonella infections impose an estimated $3.7 billion each year in the United States in medical costs, wages lost from time away from work, and societal willingness to pay to prevent deaths. Almost 90 percent of this burden—$3.3 billion—is due to premature deaths; 8 percent is due to hospitalization, and the remaining 3 percent are the costs associated with the non-hospitalized cases. The statistics for this chart and similar costs for 14 other foodborne pathogens can be found in ERS’s Cost Estimates of Foodborne Illnesses data product.
Tuesday, October 28, 2014
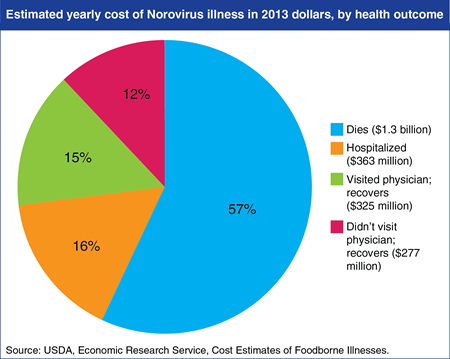
Over 95 percent of illnesses, hospitalizations, and deaths from the 9.4 million episodes of foodborne illnesses in the United States that can be tied to identifiable pathogens are caused by 15 foodborne pathogens. A new ERS data product provides cost estimates for these 15 pathogens in terms of medical costs, wages lost from time away from work, and value of death. Norvirus illnesss is the most common U.S. foodborne illness and accounts for 60 percent of foodborne illnesses that can be tied to a specific pathogen—5.5 million cases a year. Although in 90 percent of cases people recover without seeking medical care, Norovirus ranks 4th among foodborne pathogens in terms of economic burden—an estimated $2.3 billion in a typical year. Fifty-seven percent of these costs are due to deaths, 16 percent are due to hospitalizations, and the remainder are incurred by those who treat themselves at home or visit a doctor. The statistics for this chart, and similar costs for 14 other foodborne pathogens, can be found in the Cost Estimates of Foodborne Illnesses data product released on October 7, 2014.
Thursday, November 21, 2013
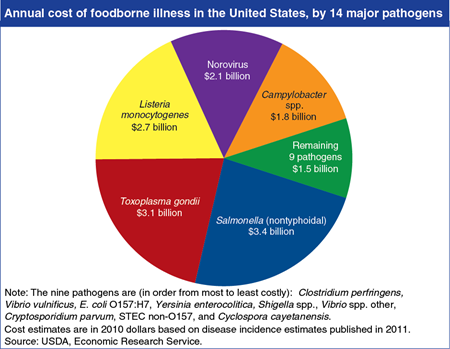
Estimates of the economic cost of foodborne illness play an important role in guiding food safety policy. A recent ERS study put the cost of foodborne illness at $14.6 billion per year, which accounts for medical care, lost time from work, and losses due to premature death. The cost of a foodborne pathogen is determined by both the number and severity of illnesses it causes. Salmonella and Toxoplasma gondii rank highest in cost because they cause the highest number of deaths each year. Norovirus ranks high because it sickens more people each year than the other pathogens, even though the symptoms of norovirus illness are generally mild and rarely require hospitalization. E. coli O157:H7 accounts for a relatively small fraction (2 percent) of illness costs attributed to the 14 major pathogens, but it receives a great deal of attention from the news media and policymakers partly because it can have severe impacts on children. This chart appears in “Recent Estimates of the Cost of Foodborne Illness Are in General Agreement” in ERS’s November 2013 Amber Waves magazine.
Wednesday, August 7, 2013
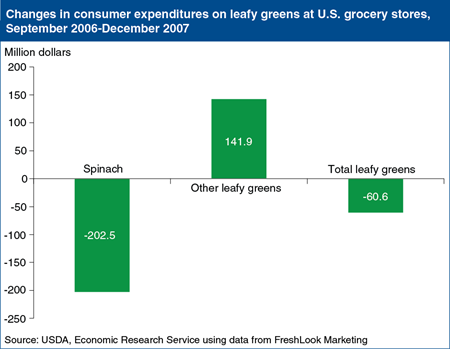
In January 2011, Congress passed the Food Safety Modernization Act, which included a set of mandatory food safety practices for U.S. produce growers. Produce imports would need to provide the same level of public health protection. The new regulations, designed to reduce the risk of foodborne illnesses, followed several major foodborne illness outbreaks traced to produce. In 2006, an outbreak traced to spinach contaminated with E. coli O157:H7 resulted in over 300 illnesses and 3 deaths. For about 2 weeks, most of the spinach in the United States was off the market following Government warnings not to eat bagged or fresh spinach. But even after the warnings were lifted, consumers were slow to return to their previous spinach purchases. ERS researchers analyzed retail scanner data and found that lost consumer expenditures at U.S. grocery stores totaled $60.6 million for all fresh leafy greens (spinach and lettuces) between the September 2006 outbreak and December 2007. Spinach sales fell by $202.5 million, while sales of lettuce grew by $141.9 million as some consumers switched from spinach to other leafy greens that were not implicated in the outbreak. The data for this chart appeared in "Consumers' Response to the 2006 Foodborne Illness Outbreak Linked to Spinach" in ERS’s Amber Waves, March 2010.
Monday, December 2, 2019
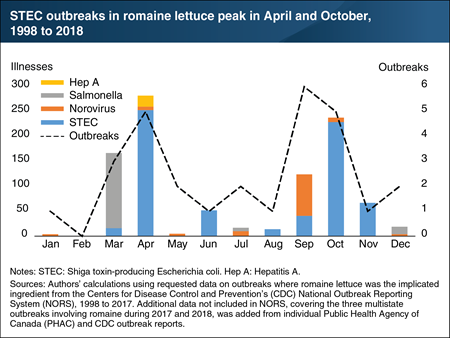
Leafy greens, including romaine lettuce, are the sixth most commonly consumed type of vegetable in the United States. About three-quarters of U.S. romaine shipments come from two regions, California’s Central Coast and Yuma, Arizona; the rest come from other areas in the United States, Mexico, and Canada. From May to November, about three-quarters of romaine lettuce shipments in the United States come from California’s Central Coast region, while from December to April, about three-quarters come from the Yuma, Arizona region. From 1998 to 2018, foodborne illnesses and outbreaks associated with romaine lettuce occurred most frequently during March, April, September, and October—the time of the season prior to shifts in regional production. In 2017 and 2018 there were three multi-state, multi-national foodborne illness outbreaks of Shiga toxin-producing Escherichia coli (STEC) O157:H7 associated with the consumption of romaine lettuce in the U.S. and Canada. These outbreaks led to a total of 376 illnesses, 158 hospitalizations, and 7 deaths. This chart appears in “Special Article: Seasonality in Romaine Outbreaks and Regional Shipments” in the Vegetables and Pulses Outlook newsletter, released in May 2019.


