ERS Charts of Note
Subscribe to get highlights from our current and past research, Monday through Friday, or see our privacy policy.
Get the latest charts via email, or on our mobile app for  and
and 
Thursday, August 21, 2014
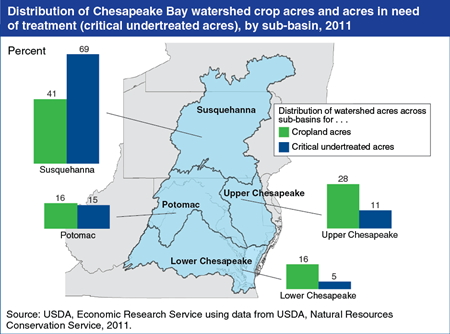
The Chesapeake Bay is North America’s largest and most biologically diverse estuary, and its watershed covers 64,000 square miles across 6 States (Delaware, Maryland, New York, Pennsylvania, Virginia, and West Virginia) and the District of Columbia. In 2010, the U.S. Environmental Protection Agency established limits for nutrient and sediment emissions from point (e.g., wastewater treatment plants) and nonpoint (e.g., agricultural runoff) sources to the Chesapeake Bay in the form of a total maximum daily load (TMDL). Agriculture is the largest single source of nutrient emissions in the watershed. About 19 percent of all cropped acres in the Chesapeake Bay watershed are critically undertreated, meaning that the management practices in place are inadequate for preventing significant losses of pollutants from these fields. Critically undertreated acres are not distributed among the four sub-basins in the same way as cropland. For example, the Susquehanna watershed contains 69 percent of critically undertreated acres but only 41 percent of cropland. Targeting conservation resources to highly vulnerable regions could improve the economic performance of environmental policies and programs. This chart displays data found in the ERS report, An Economic Assessment of Policy Options To Reduce Agricultural Pollutants in the Chesapeake Bay, ERR-166, June 2014.
Tuesday, August 12, 2014
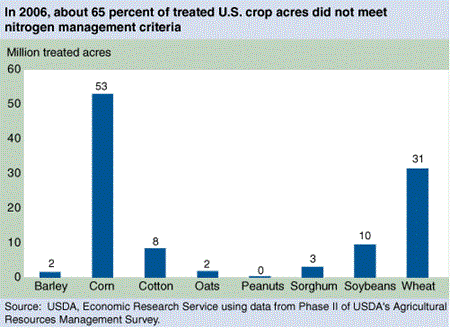
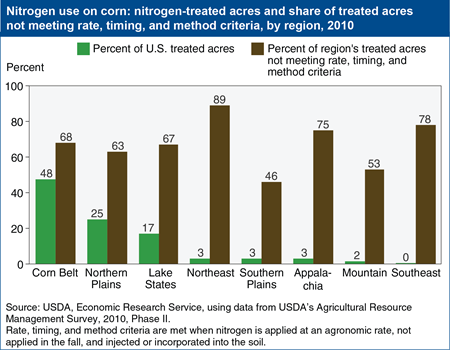
Corn is the most widely planted crop in the U.S. and the largest user of nitrogen fertilizer. By using this fertilizer, farmers can produce high crop yields profitably; however nitrogen is also a source of environmental degradation when it leaves the field through runoff or leaching or as a gas. When the best nitrogen management practices aren’t applied, the risk that excess nitrogen can move from cornfields to water resources or the atmosphere is increased. Nitrogen management practices that minimize environmental losses of nitrogen include applying only the amount of nitrogen needed for crop growth (agronomic rate), not applying nitrogen in the fall for a crop planted in the spring, and injecting or incorporating fertilizer into the soil rather than leaving it on top of the soil. In 2010, about 66 percent of all U.S. corn acres did not meet all three criteria. Nitrogen from the Corn Belt, Northern Plains, and Lake States (regions that together account for nearly 90 percent of U.S. corn acres) contribute to both the hypoxic (low oxygen) zone in the Gulf of Mexico and to algae blooms in the Great Lakes. This chart is based on data found in the ERS report, Nitrogen Management on U.S. Corn Acres, 2001-10, EB-20, November 2012.
Thursday, June 12, 2014
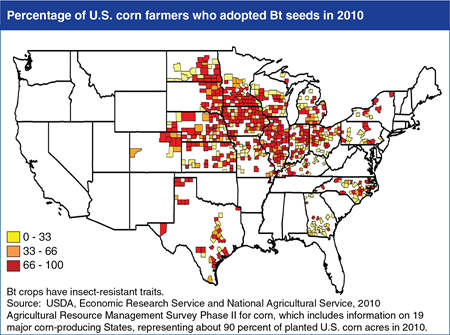
Genetically engineered (GE) crops are being developed with various traits; the most widely-adopted GE crops to date are designed to help farmers control insect and weed pests. To control insect damage, Bt corn is genetically engineered to carry the gene from the soil bacterium Bacillus thuringiensis, which produces a protein that is toxic when ingested by certain insects. Bt corn with traits to control the European corn borer was introduced commercially in 1996, with additional traits to control other types of insects introduced beginning in 2003. Farmers planting Bt crops benefit from decreased dependence on weather conditions affecting the timing and effectiveness of traditional insecticide applications because the Bt toxin remains active in the plant throughout the crop year. By improving pest control, Bt corn produces higher yields when pest infestation is a problem. More than 60 percent of U.S. corn farmers planted Bt corn in 2010 in response to the threat of highly localized insect infestations. This chart is found in the ERS report, Genetically Engineered Crops in the United States, ERR-162, February 2014.
Wednesday, May 28, 2014
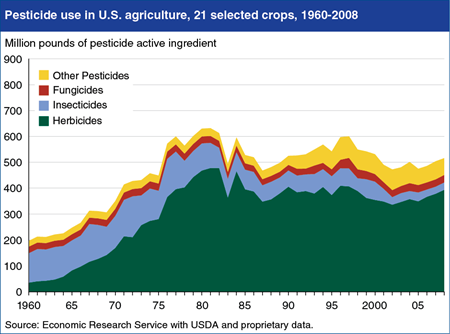
Pesticide use in U.S. agriculture grew rapidly between 1960 and 1981 before declining slightly over the last 3 decades. The total quantity of pesticide active ingredients applied to 21 selected crops (that accounted for more than 70 percent of the sector’s total use of pesticides) grew from 196 million pounds in 1960 to 632 million pounds in 1981. Over this period, the share of planted acres treated with herbicides for weed control increased, as did the total planted acreage of corn, wheat, and particularly soybeans, further increasing herbicide use. Since 1980, over 90 percent of corn, cotton, and soybean acres were treated with herbicides, leaving little room for increased use. The application of improved active ingredients, new modes of action having lower per-acre application rates, and recent technological innovations in pest management have also contributed to declining pesticide use. While farmers have used insecticides and fungicides for many decades, the widespread use of herbicides is a more recent phenomenon, as weed control was previously achieved by cultivation and other methods. This chart is found in the ERS report, Pesticide Use in U.S. Agriculture: 21 Selected Crops, 1960-2008, EIB-124, May 2014.
Monday, August 12, 2013
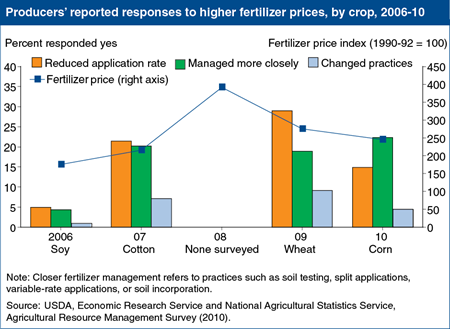
Fertilizer prices have increased overall since 2006, reaching historical highs in 2008. Fertilizers are an important input into farming and higher prices have forced farmers to alter their use. Beginning in 2006, USDA’s Agricultural Resource Management Survey (ARMS) asked farm operators how they adjusted their operations in response to higher fertilizer and fuel prices. For most crops (soy, cotton, and wheat) farmers responded to higher prices by reducing their application rate. However, the largest users of fertilizer—corn farmers—responded most often that they managed fertilizer use more closely, for example by using practices such as soil testing, split applications, variable-rate applications, or soil incorporation. This chart is found in the ERS report, Agriculture's Supply and Demand for Energy and Energy Products, EIB-112, May 2012.
Thursday, June 20, 2013
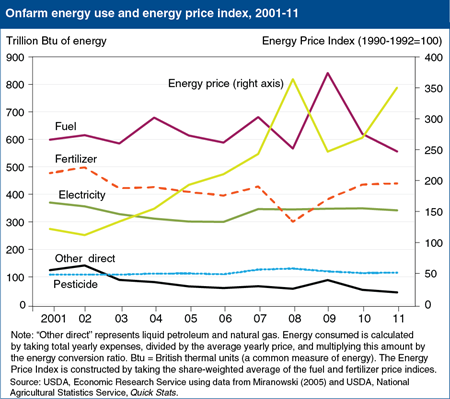
Energy is used for agricultural production both directly, in the form of fuels and electricity to run farm machinery, and indirectly, through the use of energy-intensive inputs, such as fertilizers and pesticides employed to grow crops. From 2001 to 2011, direct energy use consistently accounted for most of the energy used in farming (63 percent in 2011). Fuel usage is the largest individual component of onfarm energy use, followed by indirect use through the energy embodied in fertilizers and pesticides. Fuel energy use increased slowly through the early 2000s before spiking in 2009 as fuel prices dropped from the previous year’s levels. In 2011, higher prices led to a decline in fuel use. As energy prices rose during the last decade, farm operators adjusted their practices to reduce both direct and indirect energy use where possible. Effective measures taken by farmers to offset higher costs include applying fewer inputs, using more efficient machinery, and reducing field operations. Indeed, during a period in which U.S. agricultural output increased by roughly 10 percent, total onfarm energy use rose only 6 percent. This chart is found in the June 2013 issue of Amber Waves magazine.
Monday, November 5, 2012
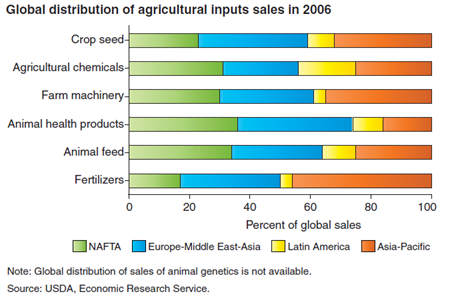
All of the leading firms in food manufacturing and agricultural input industries are multinational, offering product sales spread across several continents. One indicator of the degree of globalization of agricultural input markets is the global distribution of agricultural input sales. In 2006, member countries of the North American Free Trade Agreement (NAFTA--United States, Canada, and Mexico) accounted for about 23 percent of the global seed market and 30-36 percent of global sales of agricultural chemicals, farm machinery, animal feed, and animal health pharmaceuticals (including those for nonfood animals). The Europe-Middle East-Africa market (which is mostly Europe) had the largest aggregate seed sales in 2006, whereas Asia-Pacific countries used the most fertilizers and bought the most farm machinery. Together, Asia-Pacific and Latin America are indicative of the developing-country share of global agricultural input markets. They account for 37-51 percent of global sales of crop seed and chemicals, farm machinery, fertilizers, and animal feed. This chart is found in the ERS report, Research Investments and Market Structure in the Food Processing, Agricultural Input, and Biofuel Industries Worldwide, ERR-130, December 2011.
Friday, October 12, 2012
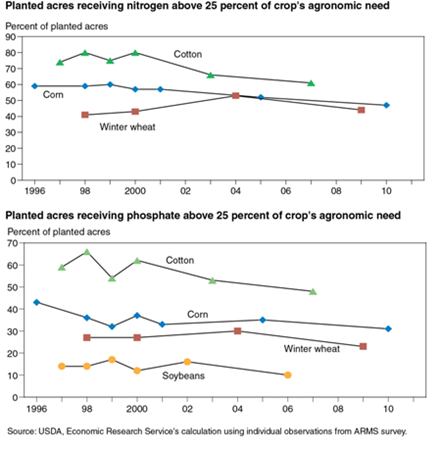
Nitrogen, phosphate, and potash are essential in the production of crops used for food, feed, fiber, and biofuel. Applied annually, most of these nutrients are absorbed by the crops, but when applied in excess, they can be lost to the environment through volatilization into the air, leaching into ground water, emission from soil to air, or runoff into surface water. These losses can be reduced by the adoption of best management practices that match nutrient supply for crop needs, minimize nutrient losses, and enhance plants' capability to uptake nutrients. For corn, the share of planted acres with excess nitrogen applied (above 25 percent of the crop's needs) declined from 59 percent in 1996 to 47 percent in 2010, while the share of acres with excess phosphate declined from 43 percent in 1996 to 31 percent in 2010. Other crops also exhibit either declining or unchanged shares of planted acres with excess use of nitrogen or phosphate. This chart can be found in the ERS report, Agricultural Resources and Environmental Indicators, 2012 Edition, EIB-98, August 2012.
Friday, September 28, 2012
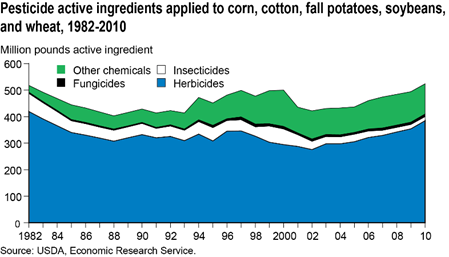
Total pesticide use on corn, cotton, fall potatoes, soybeans, and wheat was stable during 1982-2010, increasing in some years and declining in others, with an average annual increase of 0.2 percent. Herbicide and insecticide quantities applied declined 0.2 percent and 3.9 percent per year, while fungicide and other-chemical quantities increased 3.3 and 6.0 percent. Changes in the use of pesticides during this period are due to several factors, including the widespread adoption of genetically engineered crops, the expiration of the glyphosate patent in 2000, the availability of new compounds with lower application rates, boll-weevil eradication, and changes in pesticide prices, which increased slowly compared to the prices of other inputs such as fertilizer. This chart can be found in the ERS report, Agricultural Resources and Environmental Indicators, 2012 Edition, EIB-98, August 2012.
Tuesday, May 15, 2012
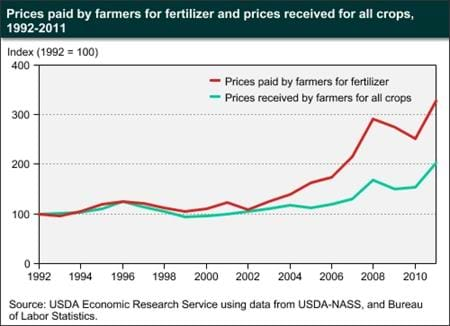
Fertilizer prices paid by farmers outpaced the increase in crop prices received by farmers from 2004 to 2008, driven largely by high energy prices and input material costs. In response to record fertilizer prices in 2008, farmers reduced fertilizer consumption, which contributed to a large decline in fertilizer prices in 2010. Since then, fertilizer prices have started to climb once again, driven mainly by strong domestic demand for plant nutrients resulting from high crop prices despite a steady decline in nitrogen fertilizer input (natural gas) costs. This chart is based on the data in table 8 of the ERS data product, Fertilizer Use and Price, updated May 4, 2012.


