ERS Charts of Note
Subscribe to get highlights from our current and past research, Monday through Friday, or see our privacy policy.
Get the latest charts via email, or on our mobile app for  and
and 
Friday, September 11, 2015
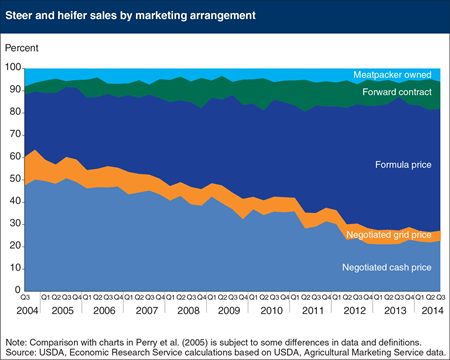
Historically, nearly all livestock were bought and sold in large, public markets where hundreds of buyers and sellers would compete for the best price based on the information that each brings to the market. These cash transactions resulted in prices and pricing information that were freely available and shared widely through public and private sources. Beginning in the mid twentieth century, the industry evolved and became more concentrated and coordinated at all levels. The use of cash markets declined sharply in favor of various forms of price contracts, such as forward contracts, marketing agreements, packer ownership, and formula pricing—where a cash price might be used for reference but premiums or discounts are applied based on a pre-determined formula. In the beef cattle market, the last decade has seen a shift away from cash market sales in favor of formula pricing, which has led to concerns that the cash prices used in those formulas could be unreliable, and that the limited volume of public sales undermines price transparency and market efficiency. The Livestock Mandatory Price Reporting Act was passed in 1999 in response to these and other concerns, and requires all major meatpackers to report the prices they pay for sheep, cattle and hogs, as well as their selling prices for lamb, beef and pork. This chart is from the ERS report, Mandatory Price Reporting, Market Efficiency and Price Discovery in Livestock Markets.
Monday, August 3, 2015
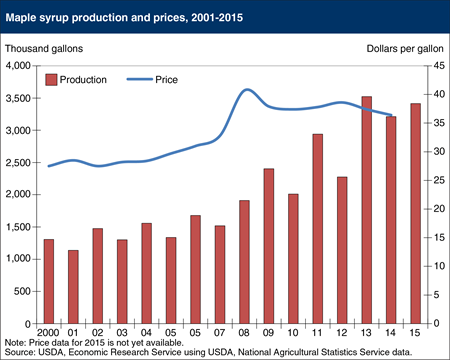
Maple syrup production in the United States was up 203,000 gallons (6.3 percent) in 2015, making it the second largest crop on record. Production of this sweetener has trended higher over the past few decades, and the 3.4 million gallons harvested this year is more than three times the amount produced in 1995. The number of tree taps this year reached almost 12 million, the highest on record, and 61 percent of those taps were in New England. Vermont is the Nation’s largest producer of maple syrup and, with New York and Maine, accounts for 75 percent of the U.S. total. Despite the steady growth in domestic production, imports from Canada still account for nearly 70 percent of U.S. consumption. The average price received by farmers in 2014 was $36.40 per gallon (ranging from $31.50 in Maine to $70.90 in Connecticut), down $1 from the previous year. The wide divergence in average prices is due to sales format—largely retail sales in Connecticut and bulk sales in Maine. This chart is from the July 2015 Sugar and Sweeteners Outlook report.
Friday, July 31, 2015
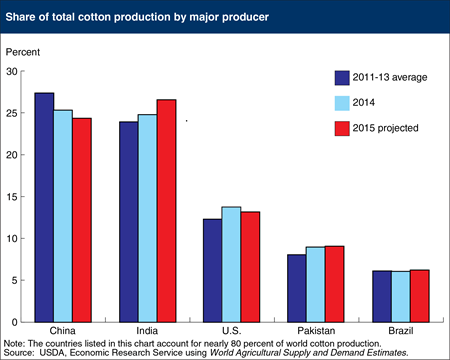
Cotton production is concentrated among only a few countries, with the world’s five largest cotton-producing countries forecast to produce nearly 80% of world production in 2015/16. India and China together account for more than 50 percent of global cotton production, but production in China is declining while increasing in India. In 2015/16, India is expected to surpass China as the world’s largest cotton producer for the first time on record, with a crop forecast at 29.5 million bales, pushing India’s share of world production to 26.5 percent. For China, 2015/16 production is forecast to decrease 10 percent (3 million bales) to 27 million bales, the lowest since 2003/04. China’s share of global production is forecast at 24 percent as area continues to trend lower. The difference in the production outlook for China and India can be traced in part to China’s rising wages and increasing production costs, while new technology and production practices have driven India’s yields and output significantly higher in recent years. Its output surpassed the United States for the first time in 2006 and is now poised to surpass China, which had been the world’s largest cotton producer since 1982. This chart is from July 2015 Cotton and Wool Outlook report.
Tuesday, June 30, 2015
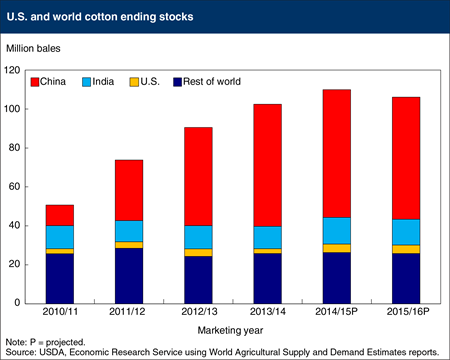
Global cotton stocks have risen over the last several years, largely the result of growth in China’s stocks. Government policies in China supported national reserve purchases of domestic cotton and, at the same time, significant imports of raw cotton. These policies strengthened global cotton prices by keeping China’s supplies out of the marketplace while also encouraging production in other countries. Stocks in China at the end of 2014/15 (August/July marketing year) are estimated at a record 65.6 million bales, or 60 percent of global stocks. For 2015/16, policy adjustments in China are expected to reduce stocks slightly to 62.6 million bales, with its share of world stocks remaining unchanged. Globally, cotton stocks are expected to decline in 2015/16 for the first time in 6 years, but would still remain more than double the level in 2010/11, resulting result in only a slight decrease in the world stocks-to-use ratio. As a result, the 2015/16 world cotton price is expected to remain near the current season’s average of about 71 cents per pound, the lowest in 6 years. This chart is from the June 2015 Cotton and Wool Outlook.
Wednesday, June 24, 2015
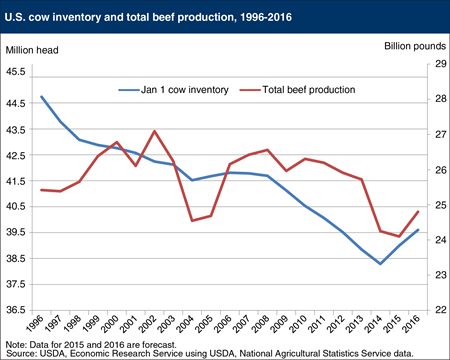
Historically small U.S. cattle inventory continues to support high beef prices in 2015, but at least in the short term, increasing imports of processing beef (especially from Australia) and heavy carcass weights have helped moderate some of the price pressures. Fed cattle live and dressed weights have remained significantly heavier than last year due in part to improvements in pasture conditions and extra time on feed as a result of reduced steer and heifer slaughter. One uncertainty is the extent to which feeding cattle to heavier weights will offset the decrease in slaughter numbers in 2015, and the ultimate effect this will have on total commercial beef production. Despite heavier cattle, U.S. commercial beef production is currently expected to fall to a multi-decade low of 24 billion pounds in 2015. U.S. beef production is expected to increase in 2016 due to a rising cattle inventory and continued heavier carcass weights. This chart is from Livestock, Dairy, and Poultry Outlook: June 2015.
Tuesday, June 9, 2015
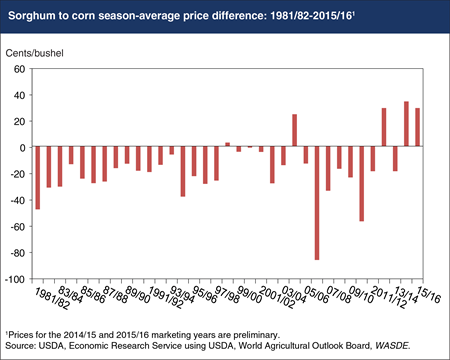
In recent years, the price of sorghum has been supported by unusually strong export demand, particularly from China. Sorghum is a common substitute for corn in feed rations and is also used for ethanol production in the United States. In most countries, corn tends to be preferred over sorghum for livestock feed, so sorghum typically sells at a discount to corn in global markets. However, since sorghum does not face import quotas and other constraints that often delay or restrict shipments of corn and distillers dried grains (DDGS) from entering the country, China’s demand for U.S. sorghum has surged. Imports by China were negligible prior to 2013, but it is now the principal buyer of U.S. sorghum and is expected to account for more than 90% of the 350 million bushels of sorghum the United States is forecast to export in the 2014/15 marketing year. The strong increase in demand has pushed U.S. sorghum prices higher, resulting in a premium over corn that is expected to persist for the second consecutive marketing year. While not without precedent, the season average price of sorghum has exceeded the price of corn only in 4 previous marketing years since 1981/82, and only 18 times in the 96-year history of sorghum price reporting. This chart is based on the ERS report, Feed Outlook: May 2015,.
Friday, May 8, 2015
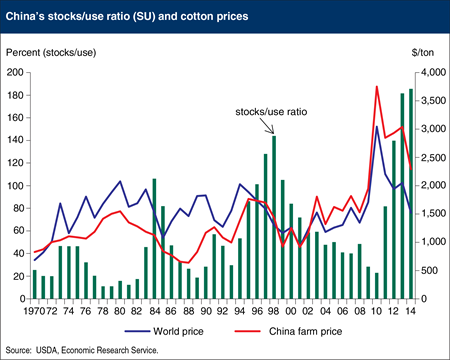
China has been the world’s largest cotton producer and consumer of cotton for decades, and it became the largest importer shortly after its 2001 accession to the World Trade Organization (WTO). Economic growth has transformed its agriculture sector, driving wages higher and spurring greater mechanization in many areas; however, small scale cotton production persists with limited mechanization and high production costs, especially in eastern China. To support its farmers, China introduced a support price for cotton in 2011, and from 2011 to 2013 acquired more than 40 percent of China’s cotton crop in an attempt to maintain domestic cotton prices 50-60 percent above world prices. This has resulted in China’s government owning a large amount of cotton stocks, equivalent to nearly 200 percent of its annual use and half of the world’s consumption. New policies in 2014 included a shift from stock acquisition toward target-price based direct subsidies and a sharp reduction in cotton import quotas. Reduced purchases by China’s government and a transition of cotton stockpiles toward long run historic levels could result in years of lower imports, and a decline in world prices. This chart is based on Cotton Policy in China, CWS-15c-01, March 2015.
Wednesday, May 6, 2015
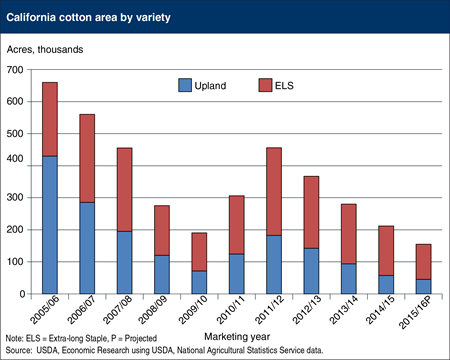
California is the fourth largest cotton producing state, and production there depends heavily on irrigation. California is the dominant producer of the longer and finer quality “Extra-long Staple” (ELS) fiber that is used in high-value products such as sewing thread and more expensive apparel and home furnishing items. During the past three years, California production accounted for 95 percent of the total ELS cotton in the United States. The on-going drought that began in 2012 remains a major concern for agricultural producers as reservoir levels and water supplies have been reduced significantly; record-low water allocations were seen in 2014, affecting the type and amount of crops some farmers can produce. While acreage planted to upland and ELS varieties varies from year to year, the lingering drought in California is expected to limit acreage once again in 2015. USDA’s Prospective Plantings report released at the end of March indicated a 27-percent decrease in the State’s total cotton area for 2015, with ELS area declining 29 percent and upland area decreasing 21 percent. While California’s total cotton area would be at its lowest since 1932, the decline is similar to the one experienced during the previous statewide drought of 2007-09. This chart is based on information in Cotton and Wool Outlook: April 2015.
Wednesday, April 8, 2015
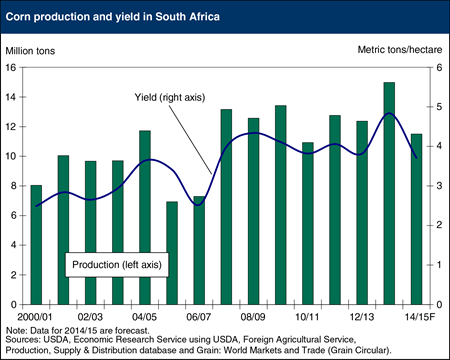
South Africa’s 2014/15 corn production is forecast at 11.5 million tons, down 23 percent from the previous year. Area harvested is expected to be unchanged from a year earlier, but yields are forecast to drop 10 percent from the 5-year average due to heat and dryness during critical growth stages. South Africa is normally one of the world’s top 10 corn exporters, with exports averaging 2.1 million tons over the last 5 years. While favorable weather and growing conditions in most major corn producing countries is supporting record world corn yields in 2014/15, South Africa, one of the last countries to harvest corn in the 2014/15 marketing year, is expected to lower corn exports by half to 1 million tons. South Africa produces both white and yellow corn, and both types are experiencing poor weather conditions this year. White corn is a staple food in South Africa, and due to the production shortfall it will require a price premium over yellow corn to channel it into human food use and away from feeding to animals. This chart is based on the March 2015 Feed Outlook report.
Friday, April 3, 2015
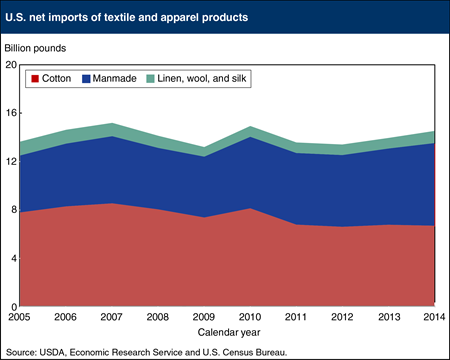
U.S. net textile and apparel fiber imports rose for a second consecutive calendar year in 2014 to their highest level in 4 years. Net imports reached approximately 14.5 billion raw-fiber-equivalent pounds in 2014, compared with 13.9 billion pounds in 2013 and a record 15.1 billion pounds in 2007. In 2014, total fiber product imports grew 3 percent to their highest since 2010, while exports rose 1 percent to their highest level since 2008. U.S. net imports consist largely of cotton and manmade fiber products, but cotton’s share has declined in recent years due to the steady growth in the use of manmade fibers, due in part to their relative price advantage. In 2014, cotton textile and apparel products accounted for about 46 percent of the total, while manmade fibers contributed 47 percent. By comparison, just 5 years ago, cotton contributed nearly 56 percent of the total compared with manmade fibers’ share of 38 percent. This chart is from the March 2015 Cotton and Wool Outlook report.
Tuesday, March 17, 2015
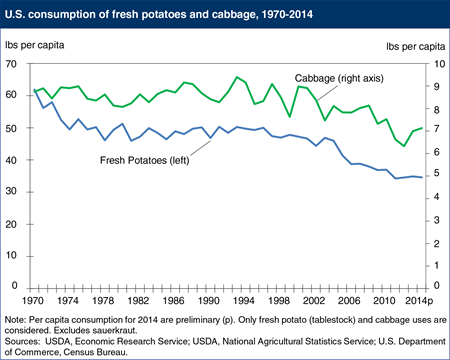
Many consumers will celebrate St. Patrick’s Day by preparing a traditional Irish-themed meal of corned beef, cabbage, and potatoes. While cabbage and potatoes remain seasonally popular, annual per capita consumption is trending lower. Beginning in the1970s and through the 1990s, consumption of fresh cabbage averaged about 8.5 pounds per capita, peaking at 9.3 pounds in 1993 with the growing availability of prepared, fresh-cut products such as slaws and salad mixes. Consumption has been trending lower since 2000, reaching as low as 6.3 pounds in 2012 before rebounding somewhat the past two years to 7.0 pounds in 2014. Consumption of fresh potatoes has been declining over a longer period, falling by about 20% during the 1970’s, before stabilizing during the 1980s and 1990s and trending lower again since 2000. The long-term decline reflects changes in the market as well as dietary shifts, including greater availability of processed potatoes (especially frozen) that supplant consumption of fresh potatoes, and growing interest in low-carbohydrate diets during the past decade that reduced consumption of all starches. This chart is based on data found in the Vegetable and Pulses Yearbook and the Food Availability Per Capita Data System.
Monday, February 2, 2015
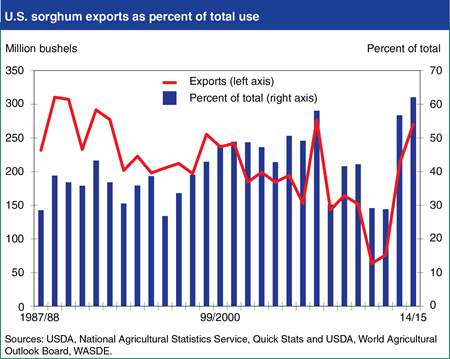
U.S. exports of sorghum have surged in the past two years, growing from less than 65 million bushels during the 2011/12 marketing year to 270 million forecast for 2014/15. Sorghum is a common substitute for corn in feed rations and is also used for ethanol production in the United States. Since in most countries corn tends to be preferred over sorghum for livestock feed, U.S. sorghum exports have been trending lower for several decades. But in recent years China has emerged as a leading destination for U.S. sorghum since sorghum does not face import quotas and other constraints that often delay or restrict shipments of corn and distillers dried grains (DDGS) from entering the country. For the current marketing year (2014/15), exports are forecast to account for 62 percent of total use, the highest proportion since 1975. The strength of the export market has also helped raise the price of sorghum, which is currently forecast to average 4 percent higher than the price of corn for the current marketing year, compared to the more common tendency for sorghum to sell at a 5 to 10 percent discount to corn. This chart is based on the January 2015 Feed Outlook report.
Thursday, May 8, 2014
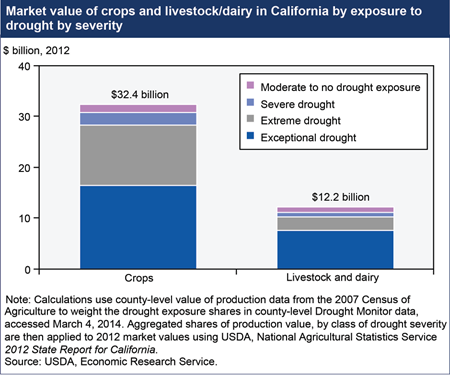
The driest year on record for California, following several prior years of drought, is likely to have an impact on the State’s agricultural production in 2014. On January 17, 2014, the Governor of California declared a drought emergency and as of March 4, over 94 percent of California’s nearly $45 billion agricultural sector was experiencing severe, extreme, or exceptional drought. The livestock sector is more directly exposed to exceptional drought (about 62 percent) than the crop sector (just over 50 percent). Given that much of California’s agricultural production takes place on irrigated land, effects of the drought depend on the cost and availability of water from irrigation in addition to local rainfall. Shortages of irrigation water sourced from snowfall are already evident, and the extent to which growers will be able to offset these reduced surface water supplies by pumping groundwater is uncertain. Find the table underlying this chart and additional analysis in California Drought 2014: Farm and Food Impacts.
Friday, January 24, 2014
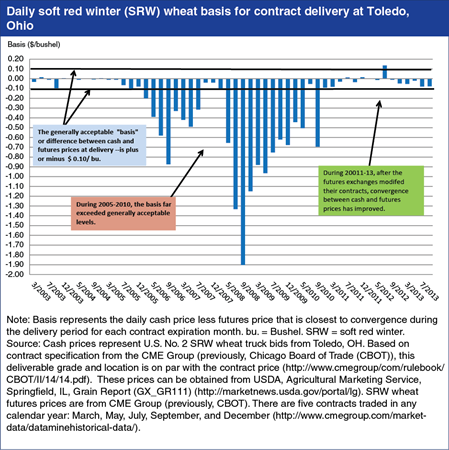
Futures markets play an important role in price discovery (determination of prices through the interaction of market supply and demand) for major agricultural commodities, and provide a tool for growers, traders, and processors to mitigate risk. For futures markets to perform these functions effectively, the price of a commodity held in a futures contract must match (or “converge”) with its price in the cash—or spot—market when the futures contract expires. During 2005-2011, cash and futures prices for soft red winter (SRW) wheat failed to converge to the generally acceptable “basis”—or difference between the cash price and futures price—of plus or minus $0.10/bushel. At times the basis exceeded $1.00/bushel. In response, the futures exchanges modified their SRW contracts to better align contract terms with changes occurring in cash markets for factors including storage rates, major delivery locations for SRW, and quality specifications. Following these changes, cash and futures market prices for SRW have moved closer together, improving the effectiveness of futures contracts in determining prices and as a tool to manage risk. This chart is based on Recent Convergence Performance of Futures and Cash Prices for Corn, Soybeans, and Wheat, FDS-13L-01, released December 30, 2013.
Friday, May 31, 2013
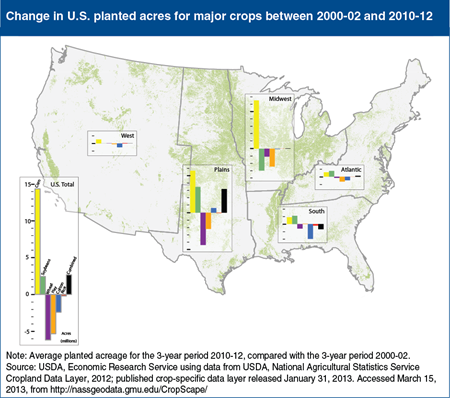
Over the last decade, the amount of U.S. acreage devoted to corn and soybeans has expanded while area of other field crops, such as wheat, hay, rice, and cotton, has tended to decline. The magnitude of these shifts varies regionally, with the Midwest and Plains States showing the biggest gains in corn acreage, while the Plains, Atlantic and Southern regions all show growth in soybean acreage that combine to offset a decline in soybean acreage in the Midwest. U.S. acreage patterns reflect changes in domestic and international demand. In the U.S., ethanol production has expanded demand for corn, while China’s rapidly growing livestock industry has boosted demand for U.S. soybeans. On the other hand, U.S. wheat faces growing foreign competition, particularly from the Black Sea region, while U.S. cotton and rice are highly dependent on foreign demand but also face stiff competition from foreign suppliers. Improved varieties of corn and soybeans have, at the same time, expanded opportunities to produce these crops in drier and more northern regions traditionally limited to wheat or other grains. This chart is found in the June 2013 Amber Waves article, “Crop Outlook Reflects Near-Term Prices and Longer Term Market Trends.”
Wednesday, April 24, 2013
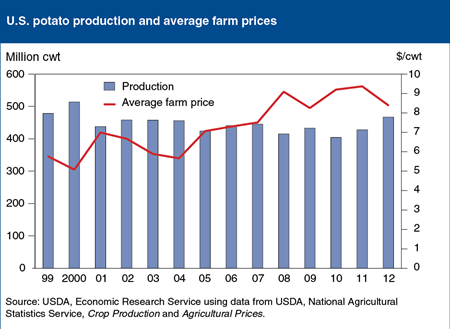
In 2012/13, U.S. potato production increased 37.5 million hundredweight (cwt) to 467 million cwt, making it the largest crop since 2000, when 523 million cwt was produced. Most of the increased output was in areas with high potato processing capacities, including Idaho and North Dakota. Fresh-market prices have fallen because of expanding supplies. Lower fresh market prices are forecast to pull down the average farm price to $8.39 per cwt, a drop of $1.02 relative to the 2011/12 marketing year price. If realized, the price decline will be the largest negative year-to-year change since the 1996/97 marketing year, when average prices fell by $1.84 per cwt in a 12-month period. This chart appears in Vegetables and Pulses Outlook, March 2013.
Wednesday, December 19, 2012
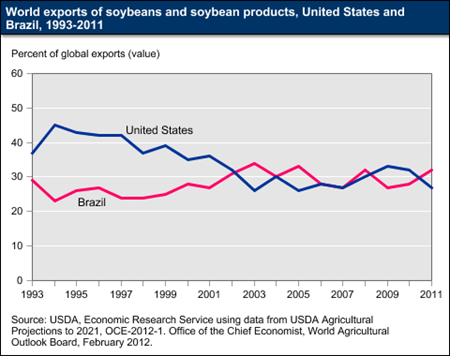
In recent years, Brazil’s production of soybeans and soybean products have risen sharply as most areas of Brazil have seen rapid increases in area planted to soybeans and rising yields. Relatively high profits for soybean producers are expected to lead to an average increase in planted area of about 2 percent per year over the next decade, with increasing soybean plantings in the Cerrado region and expansion extending into the Legal Amazon region of Brazil. Brazil’s soybeans and soybean product exports have also increased significantly and are projected to continue doing so during the next ten years, making the country the world’s leading exporter of soybeans and soybean products, ahead of the United States and Argentina. In 2011, Brazil accounted for slightly more than 32 percent of world trade in soybeans and soybean products, as income and population growth in China, other Southeast Asia, Latin America, North Africa, and Middle Eastern countries contributed to rising demand for soybean and soybean product imports. This chart is an update of one found in the Brazil topic on the ERS website.
Wednesday, November 28, 2012
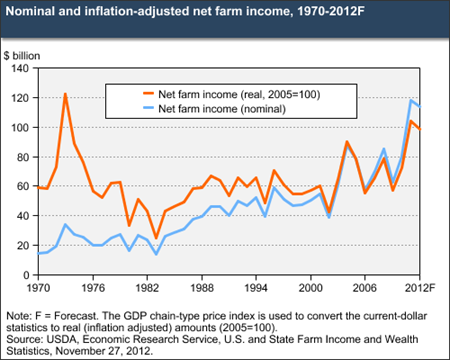
Net farm income is forecast to be $114 billion in 2012, down 3.3 percent from 2011. Despite gains in almost all sources of farm cash receipts, large increases in production expenses, especially for purchased feed, have more than wiped out the price-led gains in income. Nevertheless, after adjusting for inflation, net farm income in 2012 is expected to be the third highest in recent record, trailing only 2011 and 1973. The projected gains in 2012 livestock and crop cash receipts come mostly from expectations of price increases rather than expanding production. Oil crops and feed crops are the two leading commodities in terms of the farm sector's value of production. Total production expenses are forecast to rise 7.6 percent in 2012, led by an 18-percent increase in feed expenses. This chart is based on data from U.S. and State Farm Income and Wealth Statistics, available on the ERS website, updated November 27, 2012.
Wednesday, November 21, 2012
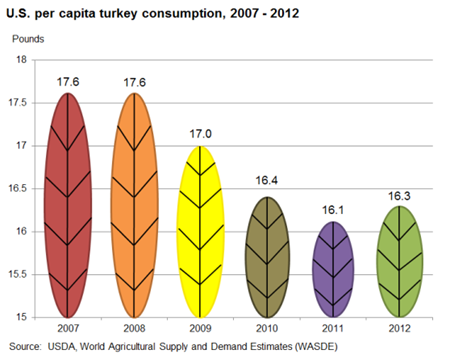
Per capita consumption of turkey in the United States has declined since 2007-2009, reflecting the impacts of the sluggish domestic economy on demand, and of higher feed and energy costs on domestic production and prices. U.S. turkey production dropped 9 percent between 2008 and 2010, but has recovered gradually during 2011 and 2012. Wholesale turkey prices rose 12.8 percent in 2011, but a more modest 3.7 percent increase is forecast for 2012. With higher production and a more moderate price increase in the forecast for 2012, per capita turkey consumption is expected to rise to 16.3 pounds, up slightly from 16.1 pounds in 2011. For more information on the U.S. turkey sector, visit the Poultry & Eggs topic page on the ERS website.
Thursday, November 8, 2012
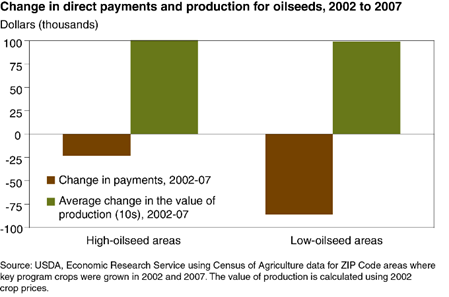
Direct payments are based on historic acreage and yields of program crops like corn and wheat and are often considered "decoupled" because they do not depend on a farmer's current production decisions. Nonetheless, because direct payments are linked to past production of program crops and because productive areas tend to remain productive over time, areas that currently have higher average yields and more acreage of program crops tend to receive more payments than areas with lower yields and fewer acres. This positive association between direct payments and production of program crops raises doubts about whether direct payments really are decoupled from current production decisions. The 2002 Farm Act authorized direct payments for the first time for oilseed crops, such as soybeans, triggering a sudden shift in direct payments toward areas with higher average production of oilseeds. By studying oilseed producers' response to the shift in payments between 2002 and 2007, ERS researchers found that direct payments had little effect on production decisions This chart appears in "Expansion in Direct Payments Did Not Lead to More Crop Production" in the September 2012 issue of ERS's Amber Waves magazine.


