Editor's Pick 2017: Best of Charts of Note
This chart gallery is a collection of the best Charts of Note from 2017. These charts were selected by ERS editors as those worthy of a second read because they provide context for the year’s headlines or share key insights from ERS research.

Friday, May 19, 2017
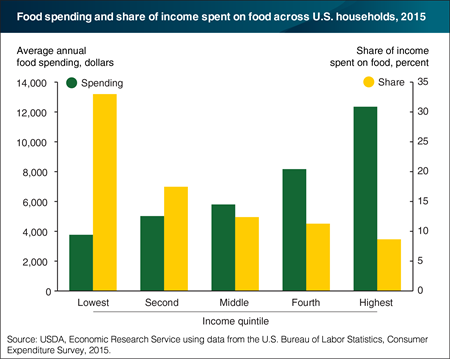
While households spend more money on food as their incomes rise, food expenditures represent a smaller portion of income as households allocate additional funds to other goods. In 2015, U.S. households in the highest income quintile spent an average of $12,350 on food—both from grocery stores and eating out. This spending accounted for 8.7 percent of their incomes. Middle income households spent an average of $5,799 on food, or 12.4 percent of their incomes. Households in the lowest income quintile spent less for food on average—$3,767 in 2015—but their food expenditures accounted for 33 percent of their incomes. Two years earlier, the lowest income quintile spent 36.2 percent of their incomes on food. The share of income spent on food depends on several factors, including food prices and incomes. While retail food price inflation was relatively low in 2013, income levels were also lower than in 2015, contributing to the higher percent of income spent on food in 2013 by the lowest income households. Food expenditures as a share of income could fall in 2016 and 2017 across income levels due to declining retail food prices in 2016 and a continued trend downwards in prices for some foods in 2017. This chart is from ERS’s Selected charts from Ag and Food Statistics: Charting the Essentials, 2017, released April 28, 2017.

