Editor's Pick 2017: Best of Charts of Note
This chart gallery is a collection of the best Charts of Note from 2017. These charts were selected by ERS editors as those worthy of a second read because they provide context for the year’s headlines or share key insights from ERS research.

Thursday, July 27, 2017
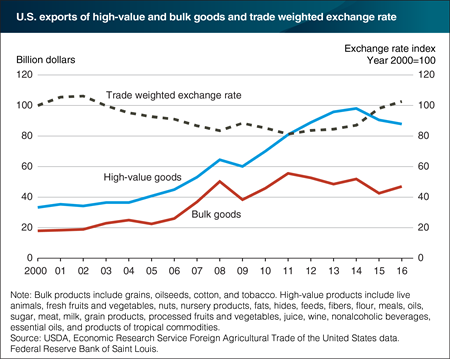
Agricultural goods can be broken into distinct categories based on value or level of processing. Bulk goods, like grains and oilseeds, are sold in large quantities at relatively low per unit costs. They also tend to be relatively standardized products. U.S. and foreign products in these categories are more readily substituted for each other, as changes in exchange rates alter relative prices among suppliers. Higher value goods, like meats, fruits and vegetables, and processed goods, are differentiated by factors such as brand, quality, or sanitary and phytosanitary standards. As a result, they may be less likely to be substituted across origins on the basis of price or relative price in the case of exchange rates. The U.S. trade weighted exchange rate index from the Federal Reserve Bank of Saint Louis has shown strong dollar appreciation since 2014, resulting in declining exports for both categories (bulk exports declined by 9 percent and high-value products fell by 10 percent). Typically, bulk goods would decline further than high-value goods during appreciation, but the 2012-13 U.S. drought had a significant impact on the supply of several major crops. As a result, export volume decreased, but value remained high because of higher commodity prices. By 2014, production of key bulk commodities like corn and soybeans recovered and have since continued to grow, drawing down prices. As prices have fallen and stocks have been replenished, export volume has increased, dulling the perceived impact of a rising dollar. This chart appears in the Amber Waves article, "U.S. Agricultural Trade in 2016: Major Commodities and Trends," released in May 2017.

Friday, April 21, 2017
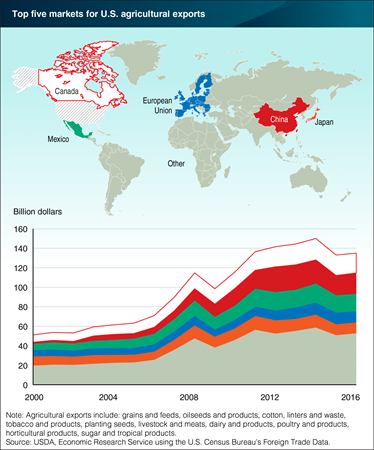
The United States exported $135 billion worth of agricultural goods in 2016. This is down from a record of $150 billion in 2014. While the Nation exports agricultural goods to most countries worldwide, a significant share goes to major trading partners. In 2016, 61 percent of the value of agricultural exports went to Canada, China, Mexico, the European Union (EU-28), and Japan. The dominance of key markets is not a new phenomenon. In fact, these five destinations have accounted for close to 60 percent of agricultural export value since at least 2000. In the case of Canada and Mexico, proximity plays a large role in its trade relationship with the United States. Additionally, regional trade agreements increased trade between the country and its nearest neighbors. The large share of trade going to China, Japan, and the EU-28 is influenced by the sheer size of the economies involved. The EU-28, China, and Japan are the three leading economies after the United States in terms of gross domestic product, and each country accounts for a significant share of global imports of agricultural goods. This chart is drawn from data in the Foreign Agricultural Trade of the United States (FATUS) data product, updated in April 2017.

