Editor's Pick 2017: Best of Charts of Note
This chart gallery is a collection of the best Charts of Note from 2017. These charts were selected by ERS editors as those worthy of a second read because they provide context for the year’s headlines or share key insights from ERS research.

Friday, May 19, 2017
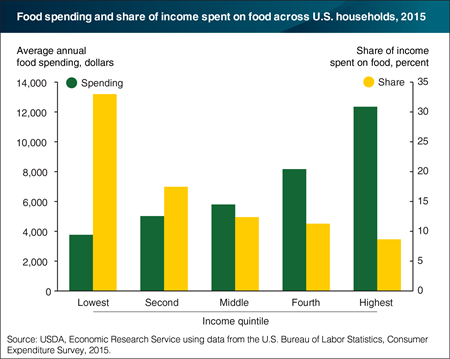
While households spend more money on food as their incomes rise, food expenditures represent a smaller portion of income as households allocate additional funds to other goods. In 2015, U.S. households in the highest income quintile spent an average of $12,350 on food—both from grocery stores and eating out. This spending accounted for 8.7 percent of their incomes. Middle income households spent an average of $5,799 on food, or 12.4 percent of their incomes. Households in the lowest income quintile spent less for food on average—$3,767 in 2015—but their food expenditures accounted for 33 percent of their incomes. Two years earlier, the lowest income quintile spent 36.2 percent of their incomes on food. The share of income spent on food depends on several factors, including food prices and incomes. While retail food price inflation was relatively low in 2013, income levels were also lower than in 2015, contributing to the higher percent of income spent on food in 2013 by the lowest income households. Food expenditures as a share of income could fall in 2016 and 2017 across income levels due to declining retail food prices in 2016 and a continued trend downwards in prices for some foods in 2017. This chart is from ERS’s Selected charts from Ag and Food Statistics: Charting the Essentials, 2017, released April 28, 2017.

Monday, March 27, 2017
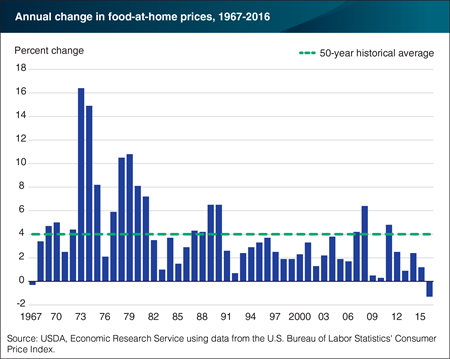
In 2016, retail food prices decreased by 1.3 percent—the first time since 1967 that grocery store (food-at-home) prices were lower than those in the year before. Over the last 50 years, food-at-home prices have, on average, risen 4 percent annually. However, year-to-year price changes have varied over time. High food price inflation in the 1970s—price increases as large as 16.4 and 14.9 percent in 1973 and 1974—was precipitated by food commodity and energy price shocks, whereas food price increases were minimal in 2009 and 2010, as the 2007-09 recession put downward pressure on prices for many goods, including food. The unusual decline in retail food prices in 2016 can be attributed to a culmination of factors. Declining prices for retail meats, eggs, and dairy during that year are largely a story about rising commodity production. Lower transportation costs due to low oil prices and the strength of the U.S. dollar also placed downward pressure on food prices in the first half of 2016. This chart appears in “Consumers Paid Less for Grocery Store Foods in 2016 Than in 2015” in the March 2017 issue of ERS’s Amber Waves magazine.

Tuesday, March 21, 2017
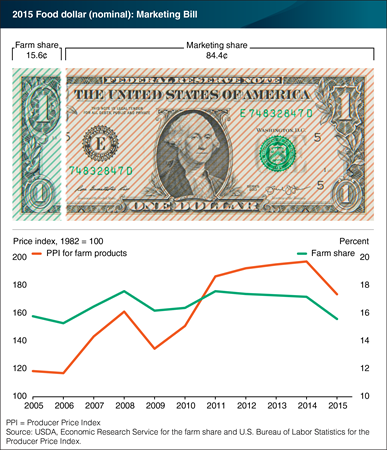
On average, U.S. farmers received 15.6 cents for farm commodity sales from each dollar spent on domestically-produced food in 2015, down from 17.2 cents in 2014. Known as the farm share, this amount is at its lowest level since 2006, and coincides with a steep drop in 2015 average prices received by U.S. farmers, as measured by the Producer Price Index for farm products. ERS uses input-output analysis to calculate the farm and marketing shares from a typical food dollar, including food purchased at grocery stores and at restaurants, coffee shops, and other eating out places. 2015 was the fourth consecutive year that the farm share has declined, but the 2015 decline was substantially more than in the three previous years. The drop in farm share also coincides with four consecutive years of increases in the share of food dollars paying for services provided by the foodservice industry. Since farmers receive a smaller share from eating out dollars, due to the added costs for preparing and serving meals, more food-away-from-home spending will also drive down the farm share. The data for this chart can be found in ERS’s Food Dollar Series data product, updated on March 16, 2017.

