

2021 Data Overview
The Agricultural Trade Multiplier (ATM) data product is prepared annually by USDA’s Economic Research Service (ERS), using ERS’s ATM model. The product provides estimates of the U.S. economic activity and jobs supported by U.S. agricultural trade, with details for 124 agricultural product groups, both at the producer’s stage (completion of production) and the port stage (exportation of the product). The port multipliers take into account the costs of warehousing, transportation, and marketing that are excluded from the producer multipliers. These multipliers measure the dollars of economic activity generated per dollar of U.S. agricultural exports and the number of jobs supported per billion dollars of U.S. agricultural exports, providing a summary of the total contribution of U.S. agricultural exports to the U.S. economy. The ATMs also provide an overview of the connections between U.S. agricultural trade, and both the domestic farm and nonfarm sectors. In addition to the agricultural products being exported, U.S. agricultural exports require output and labor from firms that process, transport, and market the agricultural goods—including any intermediate inputs used to produce that output, such as machinery and packaging. This means that the agricultural trade multipliers measure how U.S. agricultural exports support economic activity and jobs in both the farm and nonfarm sectors, taking into account the ripple effects of agricultural exports throughout the entire supply chain.
In 2021, U.S. agricultural exports totaled $177.3 billion and generated $190.5 billion in additional economic activity, for a total of $367.8 billion in economic activity. In addition, U.S. agricultural exports supported a total of 1,230,300 jobs in the economy. This number refers to full-time civilian jobs, as measured in full-time equivalents (FTEs), a conversion of the number of hours worked to an equivalent number of full-time positions. The total output and jobs multipliers associated with these numbers are 2.07 and 6,939, respectively. To help interpret these multiplier values, we can say that for every dollar of U.S. agricultural exports, a total of 2.07 dollars of economic activity was generated. Additionally, for the jobs multiplier, we can say that for every billion dollars of U.S. agricultural exports, 6,939 jobs were supported in the U.S. economy. If we want to calculate the additional output multiplier, we simply subtract 1 from the total output multiplier to obtain 1.07, meaning that for every dollar of U.S. agricultural exports, an additional 1.07 dollars of output was produced.
The above numbers were calculated with the inclusion of biodiesel as an agricultural product, given that soybean oil is the largest feedstock for U.S. biodiesel production, even though biodiesel is not classified by the WTO as an agricultural product. The inclusion of biodiesel adds about $718 million to U.S. agricultural exports in 2021, bringing the total value of U.S. agricultural exports to $177.3 billion. Without biodiesel, in accordance with the WTO definition for agricultural products, U.S. agricultural exports instead totaled $176.6 billion in 2021.
A Diversity of Export Products, Concentrated in Certain Product Groups
Although a wide variety of agricultural goods are exported from the United States every year, this trade is often concentrated in a few product categories. In 2021, the top 10 product groups accounted for roughly 61 percent of the total value of U.S. agricultural exports (table 1). Narrowed even further, the top 5 product groups accounted for almost half (46.8 percent) of the value of total U.S. agricultural exports. The labor required to produce, process, market, and transport agricultural exports varies by product group. So does the additional economic activity generated by the exports. For instance, each $1 billion of soybean exports in 2021 supported about 6,702 jobs and $722 million in additional economic activity (output), while each $1 billion of bovine meat exports supported about 8,784 jobs and $1.83 billion in additional output.
Impacts of Agricultural Trade in 2021
Table 2 presents the results of the ATM model for 2021, showing the amount of U.S. economic activity supported by agricultural trade. In 2021, the $177.3 billion of U.S. agricultural exports (line 6) produced an additional $190.5 billion (line 7) in economic activity, for a total of $367 billion of economic output (line 1). The $177.3 billion in exports is freight on board (f.o.b.), meaning that the total export value includes trade and transport margins added to the production or farm cost, to bring the product to the export port for shipping.
As mentioned previously, (on average) each dollar of U.S. agricultural exports supported $2.07 of business activity, including the exports themselves (line 15). This output multiplier equals the ratio of the total economic output supported by U.S. agricultural exports ($367 billion) to the total value of these exports ($177.3 billion). By subtracting the number one from the output multiplier, we can calculate the additional economic activity supported on average by each dollar of U.S. agricultural exports, which is $1.07 (line 16). This new value equals the ratio of the additional economic activity supported by U.S. agricultural exports ($190.5 million) to the total value of these exports ($177.3 billion).
Table 2: U.S. economic activity supported by agricultural trade, 2021 and 2020
The $190.5 billion of supporting or indirect activity generated by agricultural exports in 2021 includes activities both in the farm sector (such as crop and livestock production) and in the nonfarm sectors related to production agriculture (such as food processing, other manufacturing sectors, and activities required to move exports to their final destinations). Examples of these nonfarm activities include computer and financial services, warehousing and distribution, packaging, and additional processing. The ATM estimates for economic activity generated by agricultural exports underscore the importance of these exports to the services, transportation, and trade sectors—which account for $79.5 billion (line 13) of the total $190.5 billion in indirect activity. Supporting activity in the farm sector is estimated to be $43.6 billion (line10). The farm sector's $104.5 billion of output associated with agricultural exports (line 2) is the sum of exported raw agricultural products ($54.2 billion; not shown in the table) and supporting activity in the farm sector ($43.6 billion). Overall, the farm sector’s share of the income supported by agricultural exports is 25.9 percent (line 37) whereas the share related to the services, trade, and transportation sectors is 46.7 percent (line 38).
In its Bulk-Intermediate-Consumer Oriented (BICO) classification scheme, USDA divides agricultural trade into three broad categories of products: bulk, intermediate, and consumer-oriented. The last two categories make up nonbulk products—such as soybean meal, distillers’ dried grains with solubles (DDGS)—and ethanol (intermediate products) and meat, fruit, and vegetables (consumer-oriented products). In the ATM model, bulk exports are defined as: soybeans, other oilseeds, corn, rice (including milled rice), sorghum, wheat, other grains, pulses, cocoa beans, coffee (not roasted, not decaffeinated), tobacco, cotton, sugar beets and sugarcane, and seaweed and other algae. These product groups do not precisely match those in the BICO classification scheme because a few products classified as bulk in BICO are included in nonbulk product groups in the ATM model. Thus, the trade values for bulk and nonbulk products in the multiplier model differ somewhat from the ones reported in U.S. agricultural trade statistics. For the latest U.S. agricultural trade statistics, as well as a complete listing of the products in each BICO category, see USDA’s Global Agricultural Trade Statistics (GATS) database.
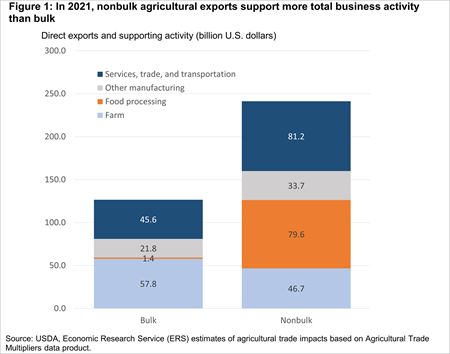
In 2021, U.S. bulk agricultural exports equaled about $65.9 billion (line 6). Bulk exports supported an additional $60.7 billion of business activity (line 9). Thus, on average, each dollar of bulk exports generated $0.92 of additional economic output (line 16). Nonbulk exports (all agricultural exports other than bulk exports; estimated at $111.5 billion in the model) stimulated an additional $129.7 billion of business activity. Thus, each dollar of nonbulk exports generated $1.16 of additional output, on average.
Bulk exports have a proportionately larger effect on the nonfarm economy than nonbulk exports. For bulk exports, 89.3 percent ($54.2 billion) of the additional business activity took place in the nonfarm economy—including $32.1 billion in the services, trade, and transportation sectors. In comparison, 71.4 percent ($92.6 billion) of the additional business activity resulting from nonbulk exports occurred in the nonfarm economy—including $47.4 billion in services, trade, and transportation. By dividing the total economic activity supported by agricultural exports (line 1) by the economic activity in the farm sector supported by these exports (line 2), one can calculate the farm sector’s share of this activity. This calculation shows that the farm sector’s share of the total economic activity supported by agricultural exports is larger for bulk exports (45.7 percent) than for non-bulk exports (19.4 percent). This outcome makes sense because the processing of these bulk exports, and the marketing and retailing of the resulting final products, primarily take place abroad.
Download chart data in Excel format
Export Impact on Job Creation
In ERS’s ATM model, the term “jobs” refers to full-time civilian jobs measured in full-time equivalents (FTEs). An FTE is a conversion of the number of hours worked to an equivalent number of full-time positions. ERS uses a ratio of 2,080 hours per year per FTE for its ATM model.
Agricultural exports in 2021 supported about 1,230,300 full-time civilian jobs—458,300 jobs in the farm sector and 772,000 jobs in the nonfarm sector (table 2, lines 17–19). In the farm sector, these jobs included labor provided by the farm operators, their family members, hired farmworkers, and contract workers. In the nonfarm sector—farmers’ purchases of fuel, fertilizer, and other inputs to produce commodities for export—spurred economic activity and created employment in the food processing, manufacturing, service, trade, and transportation sectors. The number of FTE jobs supported by non-bulk exports was 758,500, which is higher than the 471,900 FTEs supported by bulk exports. Thus, every billion dollars of U.S. agricultural exports supported 6,939 FTEs (line 23).
Impacts of Agricultural Imports on U.S. Output
U.S. agricultural imports totaled about $171 billion in 2021, according to table 2. The model assumes that certain agricultural products are noncompetitive with U.S. production and do not substitute for domestic production, as the United States lacks the extensive tropical climatic zones needed to produce these items in large quantities for commercial purposes. Therefore, we do not subtract the value of these noncompetitive imports from the total economic activity supported by trade. The imported product groups categorized as noncompetitive include bananas, plantains, pineapples, cocoa beans, coffee, palm oil, and tequila. A total of 14.9 billion dollars of the $171 billion of U.S. agricultural imports are considered noncompetitive imports, leaving a total of $156.1 billion of competitive imports (line 8).
The estimated impact on domestic output if competitive imports had been produced domestically is about $337.9 billion, according to table 2. This impact is associated with an import multiplier of 2.16, which is calculated as the ratio of the economic value of competitive imports ($337.9 billion) to the total economic value of the imports ($156.1 billion). Then, 1.16 is our additional economic value multiplier, obtained by subtracting 1 from the total import multiplier of 2.16. We can interpret this as, every dollar spent on competitive agricultural imports in 2021 would have been able to support another $1.16 in supporting goods and services if these imported items had been instead produced domestically.
We conclude the section on agricultural imports with a discussion of the limitations of our import contribution estimations. Imports are usually subtracted from economic activity under the assumption that the economic activity would have occurred domestically in the absence of those imports. This simplifying assumption prevents us from accurately assessing the impact of imports, because the end use of imported products has potentially large multiplier effects, which we cannot measure due to the lack of end-use data on imports. When imports enter the United States, their value is recorded, which allows us to measure the direct effect, but the imports are no longer tracked after that. Thus, the impacts of agricultural imports on U.S. output are generally underestimated in terms of output, employment, value added, and as a multiplier.
The end use of imports has potentially large multiplier effects. Imports can be put into inventory (resulting in a negligible multiplier) or used in a highly processed product (resulting in a large multiplier). To illustrate this point, consider cocoa. Almost all the cocoa consumed in the United States is imported. If reliable statistics on consumer demand for cocoa and its many uses were available, the supporting activity required to deliver imported cocoa could be measured. However, this measurement would only account for part of imported cocoa's contribution to the U.S. economy. Cocoa is used as an input for various products including cocoa powder, cocoa butter, and different types of chocolate. Furthermore, some of these products are intermediate inputs to produce other products—such as chocolate bars, powdered drink mixes, candy, pastries, medicinal products, skincare products, ointments, and suppositories. To fully measure the economic activity supported by cocoa imports, one would also need to distinguish the effect of imported cocoa products from domestically produced cocoa products. The data to make this distinction do not yet exist.
Comparison of Agricultural Trade Multipliers for 2020 and 2021
ERS’s Agricultural Trade Multipliers vary from one year to the next, as shown in table 2. Between 2020 and 2021, the output multiplier—the total economic activity supported by U.S. agricultural exports (including the exports themselves)—increased from the previous year by 2.3 percent to $2.07 per dollar of such exports in 2021. The jobs multiplier—the number of full-time equivalents (FTEs) supported per billion dollars of agricultural exports—fell by 8.1 percent to 6,939.
The increase in the multiplier for output comes primarily from increases in economic activity generated on the farm. Both agricultural exports and corresponding supporting activity in the farm sector increased in 2021, compared to the previous year. These increases contributed to a higher multiplier, particularly in nonbulk products in the farm sector, which saw a 17 percent increase in its multiplier. Changes in the food processing multiplier for nonbulk goods of 2.4 percent also contributed to the overall multiplier increase.
The main factor behind the 8.1 percent decrease in the jobs multiplier is due to the fact that the jobs multiplier for nonbulk products decreased significantly, by 17 percent to 6.803 in 2021. The total number of jobs supported by exports in nonbulk products actually decreased by a very small 4.6 percent in 2021, compared to the previous year. This decrease was driven entirely by decreases in employment in the farm sector for nonbulk, which fell by 28.6 percent despite the increase in exports. In all other areas, the total number of jobs increased. The jobs multiplier for bulk goods increased, but the decrease in total jobs for nonbulk farm (coupled with slight decreases in the jobs multiplier for food processing and other manufacturing nonbulk) led to the total jobs multiplier being lower in 2021 compared to 2020.
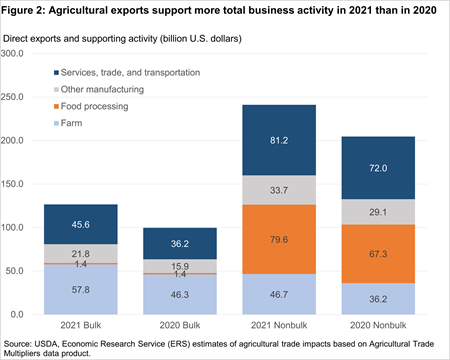
Overall, U.S. agricultural exports increased by 18 percent from 2020 to 2021, with a corresponding increase in additional economic output of 23 percent and an increase in employment supported by agricultural exports of 9 percent. The additional employment supported by agricultural exports comes mostly from bulk exports, which saw a 39 percent increase in additional employment. The increase was supported primarily in the farm and other manufacturing sectors, which saw a 63 percent and a 37 percent increase in additional employment, supported via bulk exports, respectively. Total economic output (as shown in figure 2) increased by 20.8 percent—with notable increases in the farm sector for both bulk and nonbulk at 24.8 percent and 29.0 percent, respectively—as well as in the bulk other manufacturing sector, which grew by 37.1 percent over the previous year.
Download chart data in Excel format