

U.S. Agriculture Sector Received an Estimated $35 Billion in COVID-19-Related Assistance in 2020
Highlights:
-
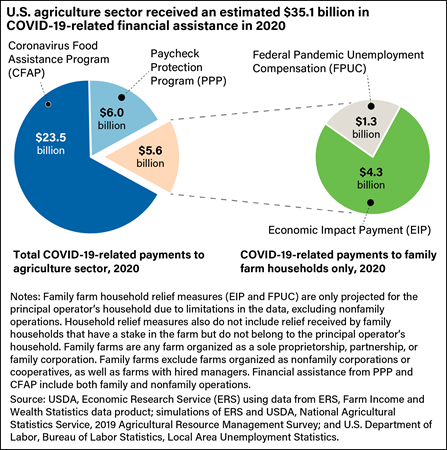
Total COVID-19-related relief to the agriculture sector estimated at $35.1 billion in 2020.
Farm operations received $29.5 billion (84 percent) of that total, while farm households received $5.6 billion (16 percent).
The two rounds of Coronavirus Food Assistance Programs (CFAP 1 and CFAP 2) in 2020 provided $23.5 billion in direct payments to farmers and ranchers, who faced additional market disruptions, production costs, and reduced farm-level prices.
The Coronavirus (COVID-19) pandemic caused disruptions to the U.S. agriculture sector, including a decline in commodity prices in the first half of 2020. To mitigate the effects of the pandemic, Congress passed six economic relief and stimulus bills in 2020. One bill authorized USDA to create the Coronavirus Food Assistance Programs (CFAP 1 and CFAP 2), which provided direct payments to farm operations. Other Federal departments and agencies created broader programs from which both farm operations and family farm households were eligible to receive assistance. For example, the U.S. Small Business Administration’s Paycheck Protection Program (PPP) offered forgivable loans, and the Economic Injury Disaster Loan Program (EIDL) provided forgivable advances. Most family farm households were also eligible for Economic Impact Payments (EIP), administered by the Internal Revenue Service (IRS). And family farm households that lost off-farm wages were eligible for the Federal Pandemic Unemployment Compensation (FPUC) administered by the U.S. Department of Labor.
Total COVID-19-related relief to the U.S. agriculture sector was an estimated $35.1 billion in 2020. Farm operations received $29.5 billion (84 percent) of that total, according to the 2021 Farm Income Forecast: September Update, while farm households received $5.6 billion (16 percent). CFAP alone provided $23.5 billion in financial assistance.
Coronavirus Food Assistance Programs
USDA developed and implemented two rounds of funding for the Coronavirus Food Assistance Program (CFAP 1 and CFAP 2). In 2020, CFAP programs provided $23.5 billion ($10.5 billion from CFAP 1 and $13.0 billion from CFAP 2) in direct payments to farm operations that faced additional market disruptions, production costs, and reduced farm-level prices. To be eligible, producers (either a person or legal farm entity) needed an average adjusted gross income (AGI) of less than $900,000 across tax years 2016, 2017, and 2018—or needed to receive 75 percent or more of their AGI from farming, ranching, or forestry. Based on data from USDA’s 2019 Agricultural Resource Management Survey (ARMS), the Economic Research Service (ERS) estimated that more than 99 percent of all farm operations were eligible to receive CFAP payments based on the AGI criteria.
The limit on each CFAP payment for an individual was $250,000. Corporations, limited liability companies, and limited partnerships could qualify for up to three times the individual payment limit (a maximum of $750,000) if at least three operators each provided at least 400 hours of active personal labor or active personnel management for the farming operation.
ERS examined the distribution of CFAP 1 and CFAP 2 funds across the farm sector using cash receipt data from the ERS Farm Income and Wealth Statistics data product and USDA’s CFAP payments online dashboard. Table 1 shows that across both CFAP 1 and CFAP 2, 49 percent (or $11.5 billion) of the $23.5 billion in total program payments were distributed to animal and animal product production and 51 percent (or $12.0 billion) to crop production. CFAP 2 was more comprehensive than CFAP 1 since CFAP 2 expanded the ways in which a commodity may qualify beyond price decreases. Only 3 percent of commodities (measured by cash receipts) were ineligible for CFAP 2 funding, compared to the 18 percent ineligible for CFAP 1. However, some commodities received greater funds from one round than the other. For example, animal and animal product production received a larger share from CFAP 1, totaling $6.9 billion or 66 percent of the total round 1 payments. In contrast, crop production received a larger share from CFAP 2, totaling $8.4 billion or 65 percent of the total round 2 payments.
| Category | Animal and animal products | Crops | ||
|---|---|---|---|---|
| Eligible | Ineligible | Eligible | Ineligible | |
| CFAP 1: applications accepted from May 26,2020 to September 11, 2020 | ||||
| Share of all cash receipts (%) | 38 | 9 | 44 | 9 |
| Share of total payments | 66 | 0 | 34 | 0 |
| CFAP 2: applications accepted from September 21,2020 to December 11, 2020 | ||||
| Share of all cash receipts | 46 | 1 | 51 | 2 |
| Share of total payments | 35 | 0 | 65 | 0 |
| Both CFAP 1 and CFAP 2 | ||||
| Share of all cash receipts | 46 | 1 | 51 | 2 |
| Share of total payments | 49 | 0 | 51 | 0 |
|
Note: The CFAP 1 deadline for some producers in Louisiana, Oregon, and Texas was extended to October 9, 2020. |
||||
Paycheck Protection Program
The Paycheck Protection Program (PPP) helped small businesses, including farm operations, keep employees on the payroll and/or bring back furloughed or laid-off workers. Administered by the U.S. Small Business Administration (SBA), the PPP targeted businesses with fewer than 500 employees per location. ERS estimated that more than 99 percent of total farm operations were eligible based on the criteria of number of employees, according to data from the 2019 ARMS. Although many farms did not have paid employees (and thus had no payroll expenses), some farm owners were eligible for PPP because they had positive net cash farm income. Farms with neither paid employees nor positive net cash farm income in 2019 were not eligible to participate.
For the entire PPP loan to be forgiven, the loan must have been spent on eligible expenses during the 24-week period after the loan was disbursed, with at least 60 percent used to cover payroll expenses. Any balance not meeting that criteria was required to be paid back and was accounted as farm debt rather than a direct payment.
In this analysis, ERS researchers assumed the entire balance of PPP loan amounts would meet program forgiveness criteria. Total PPP loans of $6.0 billion reported by SBA for the agriculture sector were distributed using the loan eligibility criteria. Data from USDA’s 2019 ARMS show that 72 percent of all farm businesses (operations with gross cash farm income of more than $350,000 or smaller operations where farming is reported as the operator’s primary occupation) would have been eligible to receive a PPP loan based on both the payroll costs and positive income criteria. Researchers estimated that farm businesses with positive net farm income and positive payroll (16 percent of the total farm businesses) could have received more than $3.6 billion in PPP loans. By comparison, farm businesses with positive net farm income and no payroll (48 percent of the total farm businesses) could have received an estimated $1.6 billion in PPP loans. And farm businesses with negative farm income and positive payroll (8 percent of the total farm businesses) could have received an estimated $723 million in PPP loans. Since participation was not uniform across a sector’s operations, the actual distribution of PPP loans could have been different than in table 2 as there were more who were eligible than chose to participate.
| Type of farm business | Share of farm businesses (percent) | Estimated PPP loans ($ millions) |
|---|---|---|
| Positive income and positive payroll (Eligible) | 16 | 3,628 |
| Positive income and no payroll (Eligible) | 48 | 1,632 |
| Negative income and positive payroll (Eligible) | 8 | 723 |
| Negative income and no payroll (Ineligible) | 28 | 0 |
| Total | 100 | 5,983 |
|
Notes: Table combines financial data with publicly available data on PPP loan disbursement for farm operations based on their 6-digit North American Industry Classification Series (NAICS) code. Calculations relied on the establishment’s designation of the majority of its revenue, which may not match the establishment’s designation used by the U.S. Census Bureau. Farm businesses are operations with gross cash farm income of more than $350,000 or smaller operations where farming is reported as the operator’s primary occupation. |
||
Using publicly released data from the SBA, ERS also estimated that the crop sector received $3.9 billion (65 percent of total loans), and the livestock sector received $2.1 billion (35 percent) in PPP loans in 2020.
Economic Injury Disaster Loan and Loan Advance
The Economic Injury Disaster Loan (EIDL) and Loan Advance programs, like the PPP, extended financial assistance to small businesses through the SBA. Farm operations with 500 or fewer employees were eligible to receive up to $150,000 in low-interest, non-forgivable loans through the EIDL program and up to $10,000 (or $1,000 per employee) in forgivable loan advances. EIDL loans had a statutory interest rate of 3.75 percent for small businesses and 2.75 percent for nonprofits for up to 30 years.
ERS researchers calculated that if all PPP applicants also claimed the maximum EIDL advance of $1,000 per employee, EIDL advances could have totaled $736.5 million in 2020. However, this amount would not have been in addition to the $5.9 billion extended under the PPP program because the amount forgiven under the PPP program would have been reduced by any EIDL advance amount.
COVID-19-Related Assistance for Family Farm Households
Family farm households received financial assistance related to COVID-19 from two main Federal sources: Economic Impact Payments (EIP) and Federal Pandemic Unemployment Compensation (FPUC). However, financial assistance was only projected for the principal farm operator’s household because of limitations in the ARMS data, which may result in an undercount of the total relief received by all family farm households. According to data published in the USDA, Economic Research Service (ERS) report America’s Diverse Family Farms: 2020 Edition, about 2 percent of farm operations were nonfamily in 2019, and there is no corresponding household relief forecast for these operations. ERS researchers also did not include relief received by households who have a stake in family farms but do not belong to the principal operator’s household.
Between April and May 2020, U.S. households received more than $266 billion in Economic Impact Payments (also known as stimulus payments). These payments provided households with an immediate injection of cash to spur overall consumer demand and mitigate the economic downturn. The full EIP amounted to $1,200 for qualifying individuals or $2,400 for qualifying couples filing jointly. Households with dependents received an additional $500 per dependent. For farm households, EIP represented a significant increase in 1 month’s income. Using data from the 2019 ARMS, ERS researchers estimated that the median married and unmarried household saw their incomes increase in 1 month by 30 percent and 24 percent, respectively.
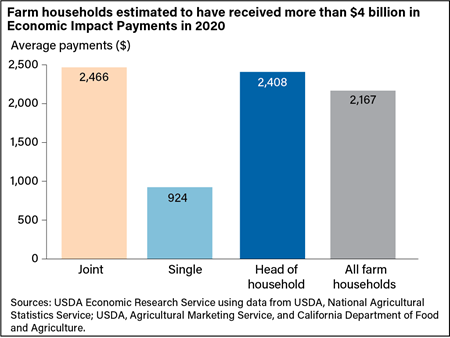
ERS researchers also estimated that the total amount of EIP disbursed to family farm households was $4.3 billion in 2020. Average payments varied by tax filing status. Table 3 shows a sizable difference between the average payments for households filing as single ($924) compared to head of household ($2,408). This disparity reflects the lower income thresholds for single households, which resulted in some not receiving the maximum EIP and others not receiving EIP at all—whereas head of household filers received an additional $500 per dependent. ERS researchers estimated that 18 percent of single households did not receive any EIP in 2020, compared to 13 percent of joint households and 17 percent of head of household filers. The average EIP payment for all farm households was $2,167 in 2020.
The Coronavirus Aid, Relief, and Economic Security (CARES) Act provided an additional $600 per week in Federal Pandemic Unemployment Compensation (FPUC) to those who were unemployed during the COVID-19 pandemic. FPUC was available to anyone who qualified for at least $1 in State unemployment benefits. The COVID-19 pandemic led to higher unemployment rates across the United States. Many farm households were affected because of their reliance on off-farm employment. According to 2019 ARMS data, 71 percent of farm households had one or more household members who earned off-farm salary or wages. These farm households earned 89 percent of their total household income from off-farm sources.
To estimate the amount of FPUC that farm households might have received as a result of off-farm unemployment, ERS researchers used county-level monthly unemployment data from the U.S. Bureau of Labor Statistics, Local Area Unemployment Statistics program and 2019 ARMS data on off-farm employment among farm households. Because of data limitations, researchers assumed the unemployment rate was uniform across the country. For 2020, the total amount of expected FPUC received by farm households was estimated at $1.3 billion, at an average of $996 per household.
Errata: On November 12, 2021, the text and the second table were revised to clarify that the Paycheck Protection Program eligibility simulation was carried out on both commercial and intermediate farm operations. No other data or findings are changed.
COVID-19 Working Paper: Financial Assistance for Farm Operations and Farm Households in the Face of COVID-19, by Anil K. Giri, Tia M. McDonald, Dipak Subedi, and Christine Whitt, ERS, July 2021
Farm Income and Wealth Statistics, by Farm Income Team, USDA, Economic Research Service, February 2024
Farms and Farm Households During the COVID-19 Pandemic, by Carrie Litkowski and Anil K. Giri, USDA, Economic Research Service, November 2023
COVID-19 Working Paper: A Timely Tool for Evaluating Financial Conditions in Agriculture: USDA Forecasts of the Value of Production in the Face of COVID-19, by Carrie Litkowski and Jonathan Law, ERS, January 2021
COVID-19 Working Paper: Financial Assistance for Farm Operations and Farm Households in the Face of COVID-19, by Anil K. Giri, Tia M. McDonald, Dipak Subedi, and Christine Whitt, ERS, July 2021
America's Diverse Family Farms: 2020 Edition, by Christine Whitt, Jessica E. Todd, and James M. MacDonald, ERS, December 2020
Rural Residents Appear to be More Vulnerable to Serious Infection or Death From Coronavirus COVID-19, by Elizabeth A. Dobis and David McGranahan, USDA, Economic Research Service, February 2021
Financial Conditions in the U.S. Agricultural Sector: Historical Comparisons, by Nigel Key, Christopher Burns, and Greg Lyons, ERS, October 2019
Farm Household Well-being, by Katherine Lim, USDA, Economic Research Service, February 2024
Farm Household Income and Characteristics, by Katherine Lim and Katherine Lacy, USDA, Economic Research Service, February 2024
Farm Sector Income & Finances, by Farm Income Team, USDA, Economic Research Service, February 2024
Farm Income and Wealth Statistics, by Farm Income Team, USDA, Economic Research Service, February 2024