

Consolidation in U.S. Agriculture Continues
Highlights:
-
The shift of agricultural production to larger operations continued through 2017, extending steady increases from the beginning of our data series in 1982.
-
The consolidation of cropland into larger farms was persistent over time and widespread across most crops and most States.
-
Major consolidation in livestock production continued to affect dairy, hog, and egg production; in contrast, the cow-calf sector, along with associated pasture and rangeland, showed little consolidation.
Agricultural production continued to move to larger farms, according to ERS analysis of the latest data from the 2017 Census of Agriculture. A March 2018 Amber Waves article, “Examining Consolidation in U.S. Agriculture,” analyzed the consolidation of U.S. crop and livestock over three decades through the 2012 Census of Agriculture. This article updates the findings of the earlier analysis.
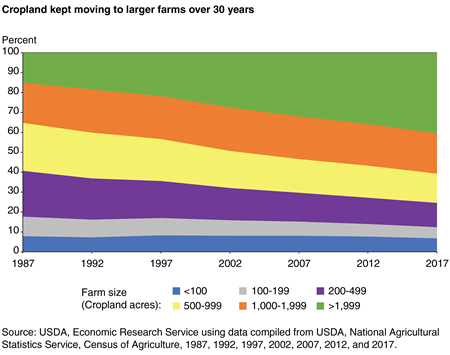
Cropland Moved to Large Operations
Over the last three decades, cropland has shifted from midsize (between 100 and 999 acres) to large operations with 2,000 or more acres in crops. In 1987, 57 percent of cropland acres were operated by midsize farms, while large farms operated 15 percent of all cropland. By 2017, the share of cropland operated by midsize farms had fallen to 33 percent, while the share operated by large farms had grown to 41 percent of all cropland. That shift occurred steadily over time, with the share of acreage operated by large farms increasing in every census from 1987 to 2017, including an increase from 36 percent of acres in 2012 to 41 percent of acres in 2017.
The shift of acreage to larger operations has been widespread across nearly all crops. To track consolidation in specific crops, ERS researchers considered changes over time in the midpoint of harvested acreage for a crop. At the midpoint, half of all harvested acres of a crop are on larger operations and half are on smaller. In 1987, for example, the midpoint acreage for corn was 200 acres—that is, half of all harvested corn acres were on farms that harvested at least 200 acres of corn, and half were on farms that harvested no more than 200 acres. The corn midpoint increased steadily, and by 2017 had reached 685 acres.
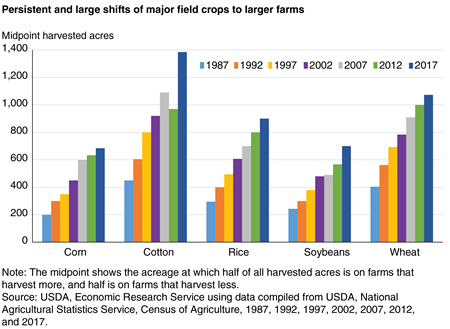
Four other major field crops (cotton, rice, soybeans, and wheat) showed a very similar pattern: the midpoint for harvested acreage increased between 1987 and 2017, by amounts ranging from 166 to 243 percent, and the midpoint increased persistently in every census year (with the single exception of cotton from 2007 to 2012).
ERS researchers extended this analysis to 10 more field crops and to 40 fruit, tree nut, berry, vegetable, and melon crops. Consolidation was nearly ubiquitous, as the 2017 midpoint acreage exceeded its 1987 level for 53 of 55 crops (the exceptions were lemons and plums/prunes). Consolidation was also substantial—the average 1987-2017 midpoint increase across the 55 crops was 148 percent, and 44 of 55 crops showed at least a 100-percent increase. Finally, consolidation was persistent over time, with continued midpoint increases for 42 crops between 2012 and 2017.
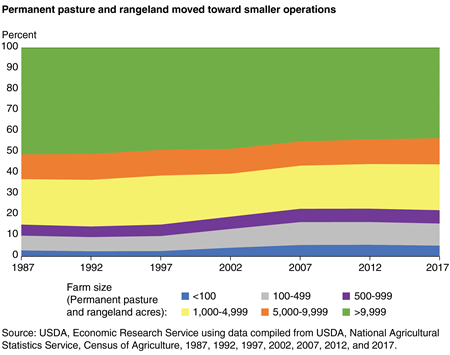
In Contrast to Field Crops, Pasture and Rangeland Shifted to Smaller Farms and Ranches
Cropland accounted for 44 percent of all U.S. farmland in 2017, while permanent pasture and rangeland accounted for 45 percent. As cropland shifted to larger operations between 1987 and 2017, pasture and rangeland moved the other way, shifting away from the largest farms and ranches toward smaller operations. Farms and ranches with 10,000 acres or more of pasture and rangeland held 43 percent of all such acreage in 2017, down from 51 percent in 1987, with most of the land moving to farms and ranches with less than 500 acres.
Consolidation in Livestock
Whereas cropland consolidation has been widespread and persistent, livestock consolidation has followed a different pattern. It is not as persistent over time as cropland consolidation, instead showing very large increases in some periods and little change in others. Moreover, in one important sector—beef cow-calf operations—there was very little consolidation.
ERS researchers tracked midpoints for each livestock commodity across census years. For livestock feeding industries like broilers, turkeys, cattle feeding, or hogs, researchers used a sales midpoint based on the number of animals sold or removed from a farm or ranch during a year. For egg layers and cows, researchers used midpoint flock or herd inventories. Some shifts have been dramatic. For example, the midpoint for U.S. milk cow herds in 1987 was 80 cows. By 2012, the midpoint herd size had increased more than tenfold to 900 cows—and it increased again to 1,300 cows by 2017. Similar dramatic transformations continued to occur in egg layers and hogs.
| Commodity | 1987 | 1997 | 2007 | 2012 | 2017 |
|---|---|---|---|---|---|
| Sales midpoint: animals sold or removed | |||||
| Broilers | 300,000 | 480,000 | 681,600 | 680,000 | 744,000 |
| Fed cattle | 17,532 | 38,000 | 35,000 | 38,369 | 42,300 |
| Hogs and pigs | 1,200 | 11,000 | 30,000 | 40,000 | 51,300 |
| Turkeys | 120,000 | 137,246 | 157,000 | 160,000 | 168,000 |
| Herd/flock inventory midpoint, end of year | |||||
| Beef cows | 89 | 100 | 110 | 110 | 120 |
| Egg layers | 117,839 | 300,000 | 872,500 | 952,201 | 1,200,000 |
| Milk cows | 80 | 140 | 570 | 900 | 1,300 |
|
Source: USDA, Economic Research Service estimates compiled from USDA, National Agricultural Statistics Service, Census of Agriculture. |
|||||
Other livestock sectors, such as broilers and cattle feeding, showed substantial but more gradual consolidation. Between 1987 and 2017, the midpoint flock and herd size in each sector more than doubled. However, the pace of change was considerably slower than in egg layers, hogs, and dairy—sectors that underwent far-reaching transformations, with dramatic changes in farm size tied to fundamental changes in farm organization, labor use, equipment, and marketing arrangement. Broilers and cattle feeding underwent such transformations in the 1960s and 1970s, with more recent consolidation focused on a gradual continuing shift to larger broiler operations with more and larger houses onsite, and to larger cattle feedlots.
Beef cow-calf operations remained the exception to consolidation in agriculture. The midpoint beef cow herd size—89 cows in 1987—increased to 120 cows by 2017, a far smaller rate of increase than that in other livestock sectors or in almost all crops. Moreover, beef cow-calf operations are the primary user of permanent pasture and rangeland, which shows no consolidation over time. The beef cow-calf sector is an important sector in agriculture—the 2017 Census of Agriculture counted 729,046 U.S. farms with beef cows. By comparison, 54,599 farms had milk cows, 66,439 had pigs, and 303,891 grew soybeans. Bigger, faster, and smarter equipment and vehicles have allowed individual farmers and farm families in other sectors to manage more animals or acres, leading to steady shifts of production to larger farms. Those developments have yet to make major impacts on the cow-calf sector.
Three Decades of Consolidation in U.S. Agriculture, by James M. MacDonald, Robert A. Hoppe, and Doris Newton, ERS, March 2018
Examining Consolidation in U.S. Agriculture, by James M. MacDonald and Robert A. Hoppe, USDA, Economic Research Service, March 2018
Large Family Farms Continue To Dominate U.S. Agricultural Production, by James M. MacDonald and Robert A. Hoppe, USDA, Economic Research Service, March 2017
Farm Structure and Organization, by Daniel Bonin, USDA, Economic Research Service, January 2024