

Monitoring Trends in Retail Prices and Farm Shares of Food Products
The marketing steps from farm to grocery store shelf vary by food product. Fresh fruit and vegetables are often sorted, washed, and sometimes trimmed and bagged. For processed products, such as cheese and orange juice, food manufacturers transform agricultural commodities into convenient food products for consumers. Handlers and wholesalers help get fresh and processed products to retailers who stock, display, and sell them to consumers. Thus, retail food prices reflect not only the value of the agricultural commodities in foods but also value added by marketers.
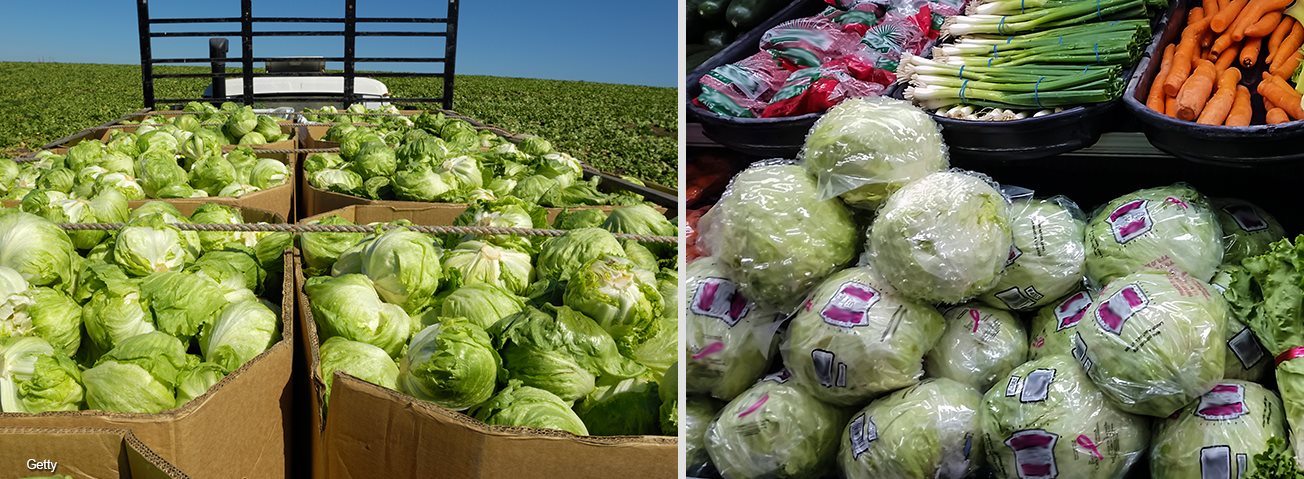
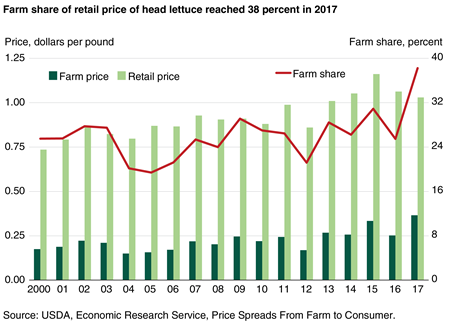
Commodity prices and marketing costs can rise and fall independently, causing swings in the farm share of retail food prices—the ratio of what farmers received to what consumers paid in grocery stores. For example, in 2017, heavy rains delayed the planting and harvesting of head lettuce. Reduced supplies pushed farm prices higher but had only a short-lived impact on retail prices. This drove the farm share of head lettuce’s retail price to 38 percent in 2017, the highest farm share for head lettuce since the 1990s.
Some Recent Price and Farm Share Movements for Lettuce …
ERS estimates the farm share of retail food prices for selected dairy products, fresh fruits, and fresh vegetables; orange juice; sugar; bread and flour; as well as meats, poultry, and eggs. These estimates are used to inform both policymakers and the agricultural community about value added by marketers and to compare marketing costs with farm receipts.
ERS researchers rely on a variety of data sources for their calculations. They use monthly, national-average retail prices reported by the Bureau of Labor Statistics (BLS) for most products and private data sources for a few others. Prices received by farmers come from USDA sources. For example, USDA’s National Agricultural Statistics Service reports monthly, national-average farm prices for a number of commodities, including head lettuce. During 2000 to 2017, the average farm price for head lettuce ranged from 15 cents per pound in 2004 to 37 cents per pound in 2017.
ERS accounts for the amount of each commodity that marketers purchase from farmers in order to supply food products at grocery stores. For head lettuce, researchers use the 7-percent loss rate reported in ERS’s Loss-Adjusted Food Availability data product to account for spoilage that may occur in transport as well as trimming that may occur in packinghouses. Thus, farmers are assumed to supply 1.08 pounds for each pound stocked at retail. Retail prices for head lettuce ranged from $0.74 to $1.16 per pound over the last 18 years.
Between 2000 and 2016, the farm share of head lettuce’s retail price fluctuated between 21 and 31 percent. However, in 2017, heavy rains early in the year in California—the source of close to three-fourths of U.S. production—caused the farm price for head lettuce to rise from 25 to 37 cents per pound. Retail prices for head lettuce fell from $1.06 to $1.03 per pound, and the farm share rose to 38 percent.
… Milk …
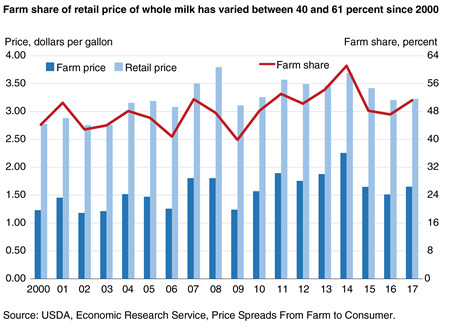
To calculate statistics for milk, cheese, and ice cream, ERS uses BLS monthly, national-average retail prices. Data from USDA’s Agricultural Marketing Service and other USDA agencies are used to estimate both monthly-average farm prices and the amount of farm milk required to manufacture dairy products. Milk sold to consumers as “whole milk” actually has some of the fat removed, so producing 1 gallon of whole milk at retail requires a little more than 1 gallon of farm milk. Producing a pound of Cheddar cheese requires about 1.2 gallons of farm milk.
Since 2000, the farm share of a gallon of whole milk has fluctuated between 40 and 61 percent, with the highest shares seen in 2013 and 2014 when the farm price reached $1.88 and $2.26 per gallon, respectively. A sharp decrease in farm prices in 2015 to $1.65 pushed down the farm share to 48 percent. In 2017, farmers received 51 percent of what consumers paid for whole milk.
… and Processed Versus Nonprocessed Products
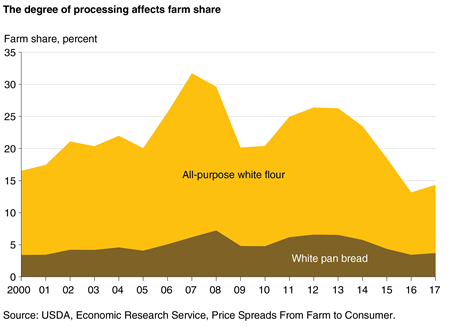
The farm share of retail prices is lower for more highly processed products. For example, the farm share for white flour, which stood at 13 and 14 percent in 2016 and 2017, is larger than that for white pan bread. Multiple ingredients are required to produce bread, including flour, high fructose corn syrup, and vegetable oil, and bread must be mixed, baked, sliced, packaged, and advertised. The farm share of bread’s retail price was 3 percent in 2016 and 4 percent in 2017. Similarly, the farm share for whole milk is higher than that for Cheddar cheese (32 percent in 2017) and regular ice cream (19 percent in 2017).
Looking Beyond Individual Food Products
In addition to monitoring farm share trends for individual foods, such as lettuce and whole milk, ERS also creates market baskets to more broadly estimate the farm share of retail food prices across a range of products. Market baskets for dairy, fresh fruit, and fresh vegetables each represent the types of products and yearly quantities bought by a typical American household. The market basket for dairy, for example, contains 14 products like whole and low-fat milk, several types of cheese, yogurt, butter, sherbet, and ice cream. In 2017, ERS estimates that farmers received 30 percent of what consumers paid for dairy products at retail grocery stores.
Finally, using a separate methodology that draws on data published by BLS and the Bureau of Economic Analysis, ERS estimates the farm share of the U.S. consumer’s overall food dollar. This component of ERS’s Food Dollar Series is known as the “food marketing bill.” In 2016, ERS estimates that farmers received 18.9 cents of every dollar that consumers spent (an 18.9-percent share) at grocery stores on domestically produced food and beverage products. Farmers received a smaller share—only 4.0 percent—of what consumers spent on domestically produced food and beverages when eating out due to added costs of preparing, serving, and, in some cases, cleaning up after meals at restaurants and other types of foodservice outlets.
Price Spreads from Farm to Consumer, by Hayden Stewart and Jeffrey Hyman, USDA, Economic Research Service, February 2024
Meat Price Spreads, by William Hahn, USDA, Economic Research Service, April 2024
Food Dollar Series, by Quinton Baker and James Chandler Zachary, USDA, Economic Research Service, November 2023