

Sub-Saharan Africa Is Projected To Be the Leader in Global Rice Imports
Highlights:
-
Rice has become a major staple food and an increasing source of calories in Sub-Saharan Africa (SSA) as economic growth and increasing urbanization change consumption patterns and consumer preferences toward rice and away from traditional food.
-
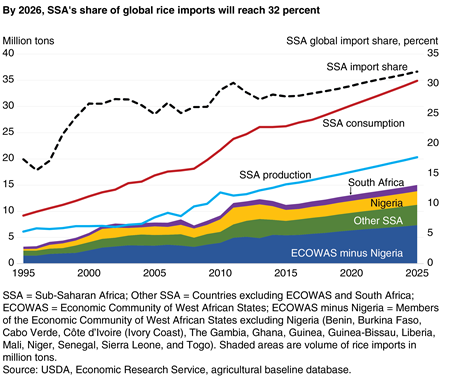
SSA rice imports will continue to grow as rising demand outpaces increases in rice production. USDA projects imports will grow from 12.3 million tons in 2017 to 15.4 million by 2026. With imports soon expected to surpass those of Asia, the region will become the leading destination in the global rice trade.
-
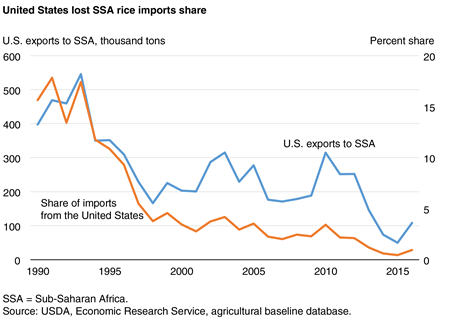
Despite rising SSA rice imports, high-priced U.S. rice has become uncompetitive in the region, and shipments from the United States have decreased from around 500,000 tons in the early 1990s, or 15 percent of SSA rice imports, to around 100,000 tons in 2016, or less than 1 percent.
Background
Sub-Saharan Africa (SSA) has undergone economic, social, and demographic transformations over the past 10 to 15 years. Among the poorest regions in the world, it faces major political and economic challenges and low food security. However, it has a young, fast-growing population and prospects for economic growth. Expanding urbanization and a rising middle class with higher incomes are driving changes in consumption patterns and preferences away from such traditional staple foods as corn and cassava and toward rice and other commodities.
With almost a billion people in 2016, SSA has the highest population growth rates in the world, averaging increases of 2.5 percent per year between 2007 and 2016. Among its subregions, South Africa’s growth rate was the lowest at 1 percent, while the 15 countries of the Economic Community of West African States (ECOWAS)—Benin, Burkina Faso, Cabo Verde, Côte d’Ivoire (Ivory Coast), The Gambia, Ghana, Guinea, Guinea-Bissau, Liberia, Mali, Niger, Nigeria, Senegal, Sierra Leone, and Togo—grew at a rate of 2.6 percent. During 2017-26, the SSA population is projected to grow at an average annual rate of around 2.3 percent, the highest projected rate for any world region, and reach more than 1.2 billion.
| Country/region | Population: 2016 total (millions) |
Population: 2007-2016 average growth rate (percent) |
Population: 2017-2026 average growth rate projection (percent) |
Per capita GDP: 2016 total (2010 US$) |
Per capita GDP: 2007-2016 average growth rate (percent) |
Per capita GDP: 2017-2026 average growth rate projection (percent) |
|---|---|---|---|---|---|---|
| Nigeria | 186 | 2.5 | 2.4 | 2,524 | 2.4 | 1.4 |
| ECOWAS minus Nigeria | 166 | 2.6 | 2.4 | 968 | 2.5 | 2.0 |
| West Africa | 352 | 2.6 | 2.4 | 1,791 | 2.4 | 1.5 |
| South Africa | 54 | 1.1 | 0.9 | 7,688 | 0.6 | 1.3 |
| Other SSA | 557 | 2.6 | 2.4 | 1,057 | 2.0 | 1.8 |
| Sub-Saharan Africa | 963 | 2.5 | 2.3 | 1,690 | 1.2 | 1.3 |
| Global | 7,251 | 1.1 | 0.9 | 10,482 | 1.9 | 1.9 |
| ECOWAS = Economic Community of West African States. ECOWAS minus Nigeria = Members of the Economic Community of West African States excluding Nigeria (Benin, Burkina Faso, Cabo Verde, Côte d’Ivoire (Ivory Coast), The Gambia, Ghana, Guinea, Guinea-Bissau, Liberia, Mali, Niger, Senegal, Sierra Leone, and Togo). Other SSA = Countries excluding ECOWAS and South Africa. Source: USDA, Economic Research Service, agricultural baseline database. |
||||||
Economic growth in SSA is projected to average 3.6 percent per year in 2017-26. Although below the 4.0-percent average gain during 2008-17, it is higher than the long-term historical trend of roughly 3.0 percent growth (1980-2015). Nigeria and South Africa are the region’s two largest economies, accounting for more than 50 percent of the total SSA economy. A recession in both countries and declining oil revenue in Nigeria are expected to cause significant growth slowdowns there. Nonetheless, economic growth in SSA is expected to continue, raising the standard of living, bringing more people into the middle class, and decreasing the poverty rate.
The SSA’s average annual gross domestic product (GDP) per capita is around $1,690, less than one-sixth of the global average. However, the regional average masks a wide range of incomes, from the lowest, $205 GDP per capita in Burundi, to the highest, $15,200 per capita GDP in Equatorial Guinea, a crude-oil exporter. The low per capita income levels in most SSA countries suggest that economic growth could raise incomes at least marginally, leading to significant changes in food consumption patterns through greater demand for calories and diversification of diets away from staple foods.
Factors driving economic growth in SSA include expanding private investments, increasing productivity in agriculture, rising exports of natural resources, infrastructure investment and development, foreign direct investment, and tourism for many SSA countries. Increasingly, international investors from China, India, and the Middle East are focusing on SSA’s growing consumer-oriented population, mainly centered in expanding urban areas.
Demand-Driven Changes
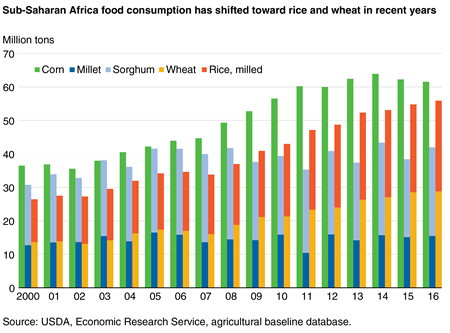
Increasing household incomes and urbanization have resulted in changes in SSA food consumption patterns and preferences away from traditional staples, such as corn, sorghum, millet, and roots and tuber products, toward rice, wheat, and meat. Over the last few decades, rice has transformed from a luxury and holiday food to a staple for the growing number of middle-income families in most of the SSA countries. Rice is now the second most important source of calories after corn, replacing roots and tubers (mainly cassava), millet, and sorghum in many SSA countries. The three largest rice-consuming countries, Nigeria, Côte d'Ivoire, and Madagascar, account for about 40 percent of SSA’s rice consumption. The 12 largest rice-consuming countries account for about 80 percent of SSA’s rice consumption. The greatest increases in rice consumption are in South Africa and West Africa.
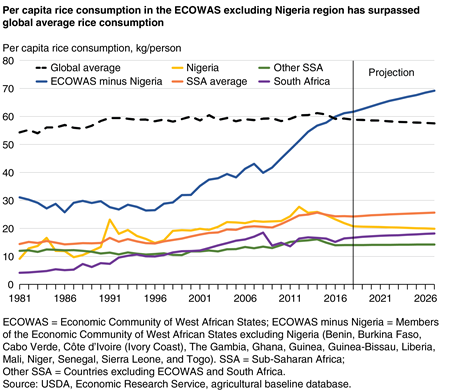
Rice Per Capita Consumption
Along with wheat and corn, rice consumption has expanded at the expense of sorghum, millet, and roots and tubers in the diets of many SSA consumers. SSA’s total rice consumption is projected to grow from the current 27-28 million tons to around 36 million tons by the end of the projection period in 2026. For middle-income urban SSA consumers, per capita rice consumption has increased for the last 2 decades. For West African countries, annual per capita rice consumption now exceeds 60 kilograms (kg), surpassing the global average for the first time in 2016. In Guinea, Guinea-Bissau, Liberia, Mali, and Sierra Leone, annual per capita rice consumption exceeds 100 kg. Because of declining oil revenue and the lack of foreign exchange reserves that have limited imports, per capita rice consumption in Nigeria decreased from a record 28 kg in 2012 to 23 kg in 2016.
Rice Production
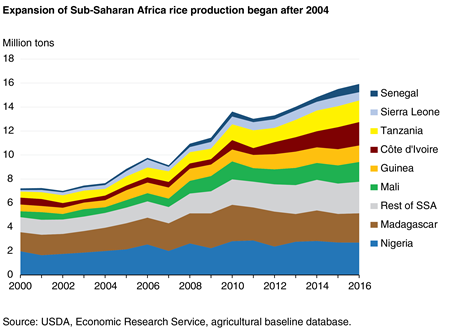
Eight countries in SSA account for 80 percent of its rice production: Nigeria, Madagascar, Côte d’Ivoire, Tanzania, Mali, Guinea, Sierra Leone, and Senegal. The two largest producing countries, Nigeria and Madagascar, account for about one-third of SSA rice production. Neither country has exhibited much expansion in rice production since 2010, with small expansion in harvested area and almost no growth in crop yields.
In 2016, the total rice area harvested in SSA was about 11.2 million hectares. The area harvested grew at an average rate of 4.2 percent in 2007-16, but it is projected to expand only around 1.8 percent per year for the next 10 years, reaching 13.7 million hectares by 2026. Côte d’Ivoire, with a 16-percent annual area-harvested growth rate, had one of the largest expansions, going from fewer than 400,000 hectares in 2007 to 1.0 million hectares in 2016. Most of the region’s projected increase in rice area and production is expected to occur in West African countries, which were responsible for about 70 percent of the region’s overall production increase during 2007-16. Among the countries where expansion is projected to continue are Senegal, Tanzania, Cote d’Ivoire, and Mali.
Despite the area expansion, rice production in SSA is constrained by low productivity, fewer seed variety choices for planting compared to Asia, poor infrastructure, and significant pre- and post-harvest losses. These losses, resulting from pest and rodent infestations; inefficiency in harvesting; and poor storage in some countries, such as Senegal, can reach up to 35 percent. SSA rice yields have been the lowest in the world. For example, during 2014-16, the average yield for SSA was around 2.1 metric tons per hectare (mt/ha), compared to the global average of around 4.4 mt/ha. The West African country of Mauritania achieved the highest yield, around 5.3 mt/ha, followed by two other West African countries, Niger, with 5.1 mt/ha, and Senegal, with 4 mt/ha.
Nigeria, SSA’s largest rice producer, had little yield growth in recent years as declining oil prices led to falling government revenue and a lack of investment in research and development. It is expected to achieve a negligible yield growth rate of just 0.2 percent for the next 10 years, much of it coming from modest area expansion.
Immediately after the 2007/08 global rice price hike, which saw the price of Thailand’s 100-percent Grade B milled rice jump nearly 200 percent, from $320 per metric ton in January 2007 to $950 in May 2008, ECOWAS countries heavily invested in research and technology to increase yields. ECOWAS’s rice yield growth had been flat from the late-1980s through 2005, at about 1.5 mt/ha. Beginning in 2006, yield growth increased, rising to 2.1 mt/ha by 2010. But yield growth has been flat since.
More recently, rice prices have dropped sharply in the global market. For example, the price of Thailand’s 100-percent Grade B milled rice dropped more than 60 percent from its peak in May 2008 of $950 per metric ton to $380. Consequently, countries have less incentive to invest in yield-expanding research and development, and the SSA yield growth rate, particularly in West Africa, is expected to grow at a slower rate than previously.
SSA rice production reached around 15.3 million tons in 2016, with more than 60 percent of the production in West Africa. But the total accounts for just 3 percent of global rice production. Over the last decade, SSA rice production has averaged close to 6 percent annual growth, primarily on expanded planted area and slight yield growth. Production growth is expected to be slower over the next decade, averaging 3 percent annually through 2026.
The SSA countries expected to increase production over the next decade include Tanzania, Angola, Côte d’Ivoire, Guinea, Mali, Senegal, and several smaller countries. However, production is not expected to keep pace with growing per capita rice consumption and population growth in these countries. Some SSA countries that do not produce rice, including South Africa, the second biggest economy in Africa, will see strong consumption growth over the next decade. Furthermore, rice production in the region exhibits high variability, partly due to erratic rains across the southern and eastern parts of the continent, which depend on rain-fed production.
Rice Trade
Increasing demand and limited production growth plus the tendency for many consumers in this region to prefer imported rice over local rice mean that imports will continue to account for a major share of SSA rice consumption. The region imported more than 12 million tons of rice in 2016. More than half went to West Africa, particularly to Nigeria. By 2026, the region is expected to import 16 million tons annually or 32 percent of globally traded rice, up from its 30-percent share between 2013 and 2015. It is projected to become the leading destination for the global rice trade, surpassing number one importer China.
SSA’s main suppliers of rice are India, Pakistan, Thailand, and Vietnam. In the early 1990s, imports from the United States totaled around 500,000 metric tons, making up 15 percent of SSA rice imports. Since then, rice imports from the United States have declined sharply as Vietnam and India entered the global rice market, offering lower quality rice at prices much lower than U.S. suppliers and rendering the United States uncompetitive in the region. Most recently, rice imports from the United States have been less than 100,000 tons or less than 1 percent of total imports. In 2016, Guinea, Côte d’Ivoire, Ghana, and Cameroon each imported around 15,000 tons of U.S. rice. As income per capita grows, however, an increasing share of the region’s population would likely opt for premium-quality rice from the United States.
SSA rice imports are expected to grow at an annual rate of 3 percent for the next 10 years, more than double the overall rate of the increase globally. Imported rice will be critical to the region’s food security, despite attempts to achieve self-sufficiency. However, a major concern for SSA is that less than 9 percent of global rice production is traded in the international market. An unanticipated significant increase in rice imports from regions outside of SSA—from adverse weather, for example—could drive global market prices higher.
Rice Policy
After the global price spike of 2007/08 left many SSA countries unable to import rice, they began to adopt national rice development programs that sought to double SSA rice production from 2008 to 2018 and reach self-sufficiency by 2025. Nigeria and Senegal’s self-sufficiency target date is 2017; Côte d’Ivoire’s is 2020. With public, private, and donor participation, the strategy calls for improving rice quality and increasing productivity through generating new seed varieties, expanding irrigation, improving rice processing, reducing post-harvest losses, and facilitating marketing through narrowing the supply chain.
By 2026, total SSA rice consumption is projected to reach 35 million tons. To attain self-sufficiency by 2025, rice production, currently at 15 million tons, would need to grow at least 10 percent per year for the next 10 years. Given that SSA rice production over the last 5 years has averaged just 3 percent annual growth, an annual 10 percent growth is unlikely. Thus, imported rice is expected to continue to be an important component of SSA food supply.
Conclusion
Growing economies, increasing urbanization, rising household incomes, improvements in infrastructure, and greater access to market outlets have all been responsible for the shift of rice from a luxury and holiday food to a major staple food and a growing source of calories in Sub-Saharan Africa. With rice consumption growing at a faster rate than rice production, and self-sufficiency unlikely in the medium term, rice imports are expected to continue to grow, filling the gap between consumption and production. With Asian rice imports flat, SSA will soon surpass Asia as the world’s leading rice importing region. Unlike in most Asian countries, where rice consumption tends to decline as incomes rise, income growth in SSA is generally associated with greater rice consumption. In addition, population growth rates in Asia are lower than those in SSA, and modest rice area expansion and yield growth in some Asian countries are projected to reduce rice imports there. Throughout the 10-year projection period, Sub-Saharan Africa is projected to be the largest rice importer in the world.
Entire Report, by Erik O'Donoghue and James Hansen, OCE, February 2017