

The Influence of Income and Prices on Global Dietary Patterns by Country, Age, and Gender
ERS recently published estimates of income and price elasticities, a measure of how responsive consumers are to income and price changes, for 11 food groups and 164 countries. The analysis is based on 2010 food-intake data from the Global Dietary Database, which provides estimates of daily consumption levels of these 11 major food groups by country, age, and gender. This database is a unique source, as most related studies are based on food expenditures which are considered a less precise measure of actual food consumption. The food price-level indexes needed for the elasticity estimates were taken from the 2011 International Comparison Program, a World Bank-administered worldwide statistical effort aimed at calculating internationally comparable gross domestic product (GDP) values.
Here we highlight results for five food groups: fruit, milk, processed meat, sugar-sweetened beverages and fish. Lower income countries—just like lower income households in high-income countries—tend to respond to price and income changes with a stronger intake reduction/increase than higher income countries.
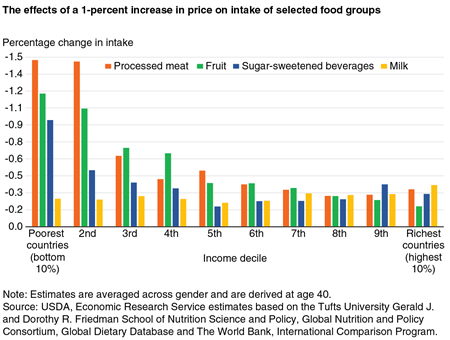
If prices are increased by 1 percent, countries in the two lowest income groups decrease intake of processed meat and fruit by more than 1 percent. This “elastic” response indicates that processed meat and fruit are considered to be luxury goods. Milk intake, however, changes very little, around 0.25 percent for the countries in the lowest income group and close to 0.4 percent in the richest countries. This low, “inelastic” response rate indicates that milk is a necessity.
Similarly, a 1-percent change in income leads to the strongest response among lower income countries, with the greatest response for milk, followed by processed meat and sugar-sweetened beverages, with intake increases of about 1.0, 0.8, and 0.6 percent, respectively. Fruit intake changes, however, are negligible, with elasticities between 0.15 and 0.2 percent across countries in all income groups.
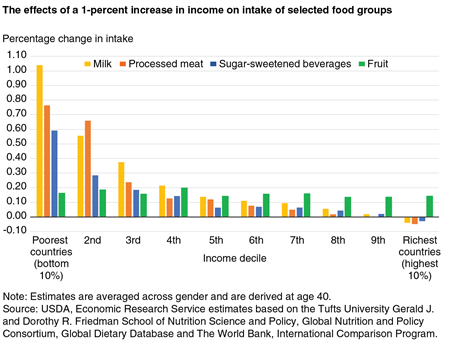
The higher income countries have very low intake response rates when income increases. A possible explanation is that once the need for a well-balanced meal is satisfied, increases in income result in increased demand for other food quality attributes, such as variety, convenience (for example, choosing packaged sliced apples), or organic food, resulting in a smaller share of additional expenditures being devoted to an increase intake amount. Interestingly, the change in fruit intake in response to a rise in income is about the same across all income groups, indicating that income growth could lead to greater fruit intake worldwide regardless of income level. However, based on these elasticity estimates, an income increase of 10 percent would increase fruit intake by just 1.5 percent, on average.
Another way of aggregating results is by region instead of income group. However, to the extent that specific regions can be categorized by income, it is apparent that the magnitude of each region’s elasticity is determined by the income level of that region.
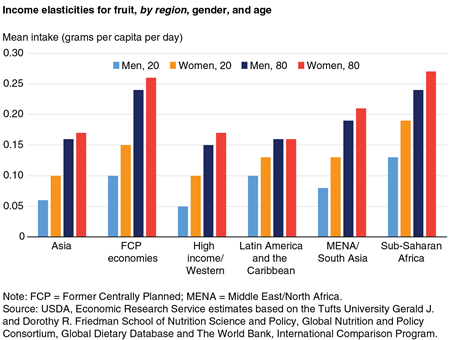
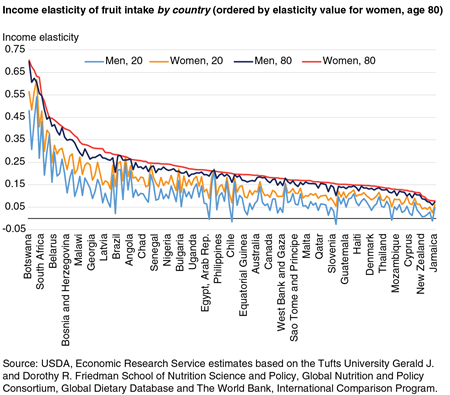
Response rates to price and income changes may also differ by gender and age. In general, elasticities tend to vary more by age and less by gender, which becomes obvious when comparing elasticities across age and gender by region or across all countries. Differences vary by the food group. For example, income elasticities for unprocessed meat are almost the same for men and women, older and younger people. Fruit income elasticities, however, do not vary as much by region and income, as we have already seen in figure 1, but they vary considerably by gender and age. Women tend to increase fruit intake more in response to an increase in income than men, and older people have a stronger response than younger adults.
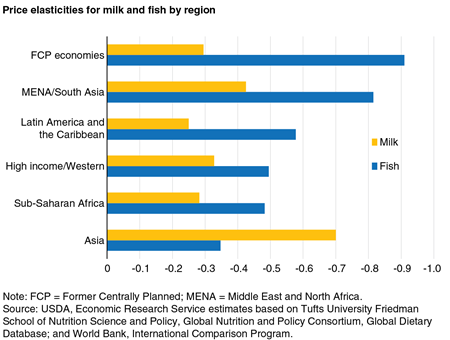
Price elasticities don’t show as much variation by gender and age, but there are differences by region. The Former Centrally Planned (FCP) economies of Eastern and Central Europe have the strongest price response in their fish intake, while milk intake in this region is one of the least responsive in the world, slightly more responsive than the Latin America/Caribbean (LAC) region, but only half as responsive as Sub-Saharan Africa (SSA). On the other hand, SSA responds the least to price changes in its fish consumption, but the most in its milk intake.
Understanding the differences in response to income and price changes by level of income, region, gender, and age can help inform the effectiveness of policies designed to increase or decrease consumption of particular foods.
The Influence of Income and Prices on Global Dietary Patterns by Country, Age, and Gender, by Andrew Muhammad, Anna D'Souza, Birgit Meade, Renata Micha, and Dariush Mozaffarian, ERS, March 2017