

Percent of Income Spent on Food Falls as Income Rises

Households spend more money on food as incomes rise but a smaller share of overall income. This phenomena is well known to economists as Engel’s Law, named after the statistician Ernst Engel (1821-1896), who observed this relationship over 150 years ago when examining household budgets. Likewise, poorer households spend less money on food than higher income households, but this accounts for a greater share of their income. They also spend less on other goods and services.
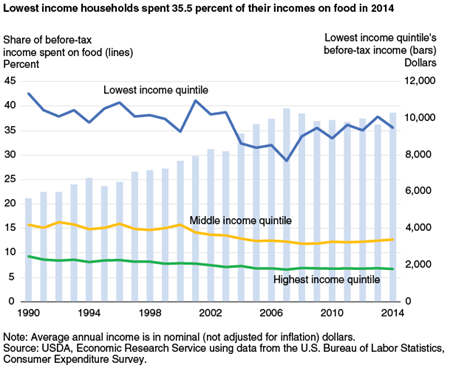
Over the past two and a half decades, U.S. households in the lowest income quintile (the poorest 20 percent of households) spent between 28.8 and 42.6 percent of their annual before-tax income on food, compared with 6.5 to 9.2 percent spent by households in the highest income quintile. Before-tax income includes earnings and other money income, public assistance, Supplemental Security Income payments, and Supplemental Nutrition Assistance Program (SNAP) benefits.
The share of income spent on food is more volatile for poorer households than for higher income households. The lowest income households saw their share of income spent on food drop from 41.1 to 28.8 percent over the years 2001 to 2007 but then rise to 35.5 percent in 2009. Meanwhile, over the same period, the highest income households saw relatively minor yearly swings of 0.5 to 1.0 percentage points.
This volatility in the share of income spent on food by the lowest income quintile is due in part to (1) changes in grocery store (food-at-home) prices and (2) changes in earned income and Federal assistance benefits. The 2001 jump in the share of income spent on food by the lowest income quintile illustrates the impact of rising food prices. Although incomes were steadily increasing for low-income households at this time, at-home food prices increased by 3.3 percent from 2000 to 2001. Higher food prices disproportionately affect the spending behavior of low-income households and often require them to allocate a larger share of their incomes to food.
The increasing share of income spent on food by the lowest income households between 2007 and 2009 was partly due to a decrease in incomes that accompanied the 2007-09 recession. In 2009, before-tax incomes fell 6.5 percent for the lowest income households, 2.5 percent for middle-income households, and 0.6 percent for the highest income households.
The post-recession period illustrates how increased Federal assistance can partly offset falling earnings and affect the share of income that low-income families spend on food. Before-tax income for the poorest households remained stable from 2009 to 2012, possibly reflecting the effects of the higher per household SNAP benefit levels Congress provided in the American Recovery and Reinvestment Act of 2009 (the Stimulus Act). This extra assistance, ending in 2013, helped the share of income spent on food by the lowest income families remain fairly stable as well. In addition, lower-than-average food price inflation in 2009 and 2010 helped offset additional increases in food spending as a proportion of income that would have occurred due to declining earnings.
Food Price Outlook, by Matthew MacLachlan and Megan Sweitzer, USDA, Economic Research Service, March 2024