

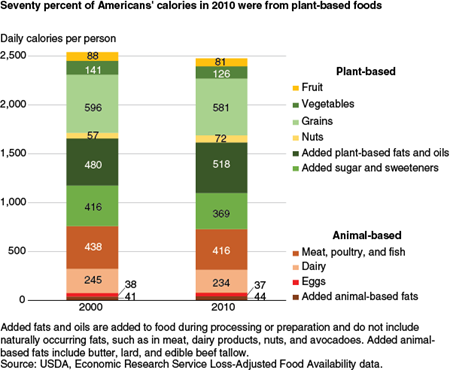
A Look at Calorie Sources in the American Diet

ERS’s loss-adjusted food availability data provide estimates of the sources of daily food energy, or calories, per capita in the United States. These data are derived from the supply of food available for consumption and adjusted for inedible peels and pits, as well as spoilage and other losses that occur from farm to retail and in grocery stores, restaurants, and homes, to more closely approximate consumption.
The 215 commodities in the loss-adjusted data are grouped into 10 categories, 6 that are plant-based and 4 that are animal-based. The amount of calories from animal-based and plant-based food is of interest since foods in the two groups contain different nutrient and caloric densities. Additionally, there is increasing interest in the amounts of energy, water, and land resources used to produce different food products.
According to ERS’s loss-adjusted food availability data, total daily calories per person decreased by 2 percent between 2000 and 2010 from 2,545 to 2,481 calories. The share of calories from animal- and plant-based foods was the same in both years at 30 percent and 70 percent, respectively. In both years, grains were the primary contributor to daily calories per capita (596 in 2000 and 581 in 2010). Added plant-based fats and oils—such as salad and cooking oil, margarine, and shortening—ranked second (480 in 2000 and 518 in 2010), followed by meat, poultry, and fish (438 in 2000 and 416 in 2010).
Between the 10 years, only 3 of the 10 food categories had changes in calorie amounts greater than 10 percent. Per capita availability of calories from nuts showed the largest percentage change with a 25-percent increase to 72 calories in 2010. There was an 11-percent decrease in calories from both the vegetable and added sugar and sweeteners categories.
While calorie shares of the broad food categories may not have changed, the amount of calories from individual food commodities in the categories did. For example, the proportion of calories from meat, poultry, and fish stayed the same at 17 percent of total calories in both 2000 and 2010, but within this category, there was an increase in calories per capita from poultry and fish and a decrease in calories from red meat. In the vegetables category, per-capita calories from kale and sweet potatoes increased, while per-capita calories available from head lettuce and white potatoes decreased.
Food Availability (Per Capita) Data System, by Linda Kantor and Andrzej Blazejczyk , USDA, Economic Research Service, April 2023