

Most U.S. Households Do Their Main Grocery Shopping at Supermarkets and Supercenters Regardless of Income

Highlights:
-
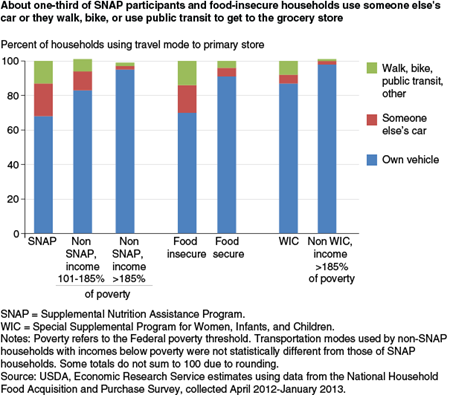
SNAP participants and households that are food insecure are less likely than higher income consumers to use their own vehicle for their primary food shopping.
-
However, differences in transportation modes do not translate into differences in the types of stores that SNAP and food-insecure households use for their food shopping.
-
Ninety percent of both SNAP and food-insecure households do their usual grocery shopping at either a supermarket or a supercenter—the same as higher income consumers.
In a 1943 speech, Winston Churchill declared “Healthy citizens are the greatest asset any country can have,” echoing a sentiment expressed by other observers of history and society. A key component to healthy citizens is a varied and nutritious diet. Where people shop for food can influence what they purchase and what they eat. If healthy foods are hard to find in a store, people may gravitate to less healthy options. If someone’s main grocery store option is a small convenience store where processed foods with fats and sugars dominate, choosing a healthy diet may be more difficult.
A new national survey jointly sponsored by ERS and USDA’s Food and Nutrition Service—the National Household Food Acquisition and Purchase Survey (FoodAPS)—is the first survey to collect comprehensive data about food purchases and acquisitions, both from grocery stores and other food retailers and from restaurants, sandwich shops, school cafeterias, and other eating places. The survey purposely included a disproportionately high number of households that participate in USDA’s Supplemental Nutrition Assistance Program (SNAP) and other low-income households to allow researchers to construct a more detailed picture of the food shopping habits of low-income Americans.
Understanding if and how shopping patterns vary for different subsets of consumers has implications for increasing the effectiveness of nutrition education and other efforts to help Americans improve their diets and health. In ERS’s initial analysis of the data, researchers looked at whether travel modes to the stores where households do their usual grocery shopping, the types of stores patronized, and distance traveled to stores differ by participation in food assistance programs or food security status.
SNAP Participants and Food-Insecure Households Are Less Likely to Use Their Own Vehicles for Their Main Grocery Shopping
How one travels to a grocery store can influence what gets purchased. If a person takes a bus or walks to a store, they are limited to what can be carried or pulled in a cart. People may be less likely to buy heavy items or multiple cans of on-sale tomato sauce if they do not have a car to get the groceries back home. Shoppers without access to a car who walk to the store every day or so may be more likely to buy fresh ingredients for that night’s dinner, or maybe their purchases consist of grab-and-go prepared meals. A person needing to borrow someone else’s car—or share a ride to a store—may not be able to shop as frequently or on their desired time schedule, for example, when supplies are running low.
FoodAPS collected detailed information about food acquisitions by all household members over a 7-day period. Data were collected between April 2012 and January 2013, and a total of 4,826 households, comprising 14,317 individuals, completed the survey. The main food shopper or meal planner for each household (the primary respondent) provided a variety of information about the household, including where the household did most of its food shopping (primary store) and the typical mode of transportation used to get to this primary store. While FoodAPS oversampled low-income households by including more low-income households in the survey than their share of the total population, responses were weighted to yield nationally representative estimates of all U.S. households as well (see box, “FoodAPS Fills Data Gaps”).
Responses to the survey reveal that most U.S. households use their own vehicles to do their primary grocery shopping. However, households that participate in SNAP and food-insecure households are less likely than non-participants and food-secure households to drive their own vehicle; they are more likely to rely on someone else’s car, or to walk, bike, or take public transit.
Sixty-eight percent of SNAP participants used their own cars for food shopping, compared to 83 percent of non-SNAP households with incomes between 101 and 185 percent of the Federal poverty threshold and 95 percent of households with incomes above 185 percent of the poverty threshold (higher income households). The methods of transportation used by non-SNAP households with income below the poverty threshold were similar to those of SNAP households. Among SNAP households, 19 percent reported using someone else’s car to do their primary shopping, and 13 percent fell into the “other” category (walked, biked, or used a shuttle or public transportation).
Researchers also analyzed differences in transportation modes between food-insecure households and food-secure households. Food-insecure households were those who reported that they were, within the last 30 days, unable to acquire adequate food for one or more household members because of insufficient money or other resources for food. Sixteen percent of food-insecure households used someone else’s car (compared to 5 percent of food-secure households) and 14 percent used other transportation modes (compared to 4 percent of food-secure households) for their primary grocery shopping.
Transportation modes to a primary grocery store for participants in USDA’s Special Supplemental Nutrition Assistance Program for Women, Infants, and Children (WIC) were also examined and compared to non-participating households that were categorically eligible for WIC—those that contained either a pregnant woman or a child under the age of 5 (comparison households). WIC participants’ modes of transportation to their primary grocery store did not differ from lower income non-WIC comparison households, but did from non-WIC comparison households with incomes above 185 percent of the poverty threshold. Eighty-seven percent of WIC households used their own vehicles for grocery shopping versus 98 percent for non-WIC comparison households with higher incomes. WIC households were also more likely to walk, bike, or use other alternative forms of transportation than non-WIC comparison households with higher incomes.
WIC Participants Favor Supercenters for Food Shopping
Supermarkets and supercenters dominate the food shopping of most U.S. households. Vehicle ownership, participation in SNAP, food-security status, and income do not appear to influence the type of stores households use for their primary shopping.
In addition to identifying their primary store, FoodAPS respondents also reported a secondary store that they regularly used as an alternative store for food shopping. These primary and alternative stores were grouped into four categories:
- Supermarkets (supermarkets, large grocery stores, and commissaries)
- Supercenters (supercenters, mass merchandisers, and club stores)
- Other retailers (smaller grocery stores, specialty food retailers like farmers’ markets and bakeries, and other retailers, such as convenience stores, dollar stores, and drug stores)
- Unknown store types (not possible to identify or classify the store)
Supermarkets and supercenters have greater depth and breadth of products than the other two categories, stocking a full line of fresh and processed meats, dairy, fruits, vegetables, bakery products, etc.
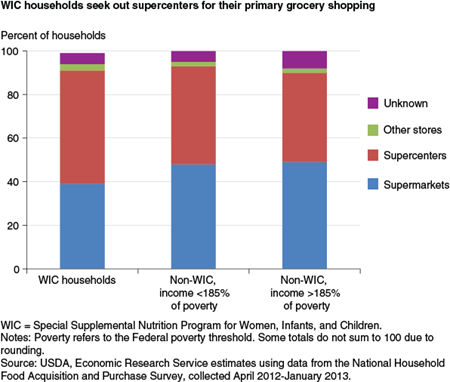
Overall, roughly 44 percent of households did their primary grocery shopping at supercenters, while another 45 percent used supermarkets for their primary shopping. Just 5 percent of households did their main shopping at other retailers. For the remaining 6 percent of households, it was not possible to identify or classify their primary store. Supercenters and supermarkets were the most common alternative stores as well, though the alternate stores identified by about 26 percent of households could not be classified, suggesting that these stores are less likely to be recognized chain stores.
SNAP households are similar to non-SNAP households in their use of supermarkets or supercenters for their primary food shopping. The same is true of food-secure and food-insecure households. Ninety percent of SNAP and food-insecure households did their primary grocery shopping at either a supermarket or a supercenter. SNAP households and food-insecure households were slightly more likely to identify an “other” store as their alternate store than higher income nonparticipants or food-secure households, indicating that at least some SNAP participants and food-insecure households rely on other retailers for some of their at-home food purchases.
WIC households, however, were more likely to use supercenters as their primary store than non-WIC comparison households. Over half of WIC households (52 percent) used a supercenter as their primary store, compared to 45 percent of non-WIC comparison households with incomes below 185 percent of the poverty threshold and 41 percent of higher income non-WIC comparison households. Because WIC households are larger and more likely to contain multiple young children compared to non-WIC comparison households, WIC households may be more enticed to shop at supercenters in order to purchase larger sized products or take advantage of one-stop shopping. WIC participants were also more likely than lower income non-WIC participants to identify a supercenter as their alternate store (49 percent compared to 36 percent) and more likely to identify an unknown alternate store than higher income non-WIC participants (27 percent compared to 19 percent).
Most Americans Bypass the Supermarket Closest to Them
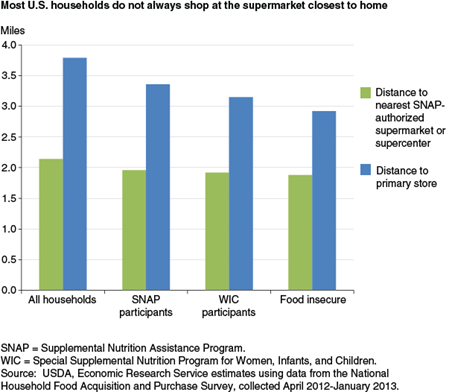
Most Americans do not necessarily shop at the supermarket that is closest to their home. Even households that do not use their own vehicles tend to travel farther than the nearest supermarket or supercenter. ERS researchers compared the distance to the nearest supermarket or supercenter to the distance to the store where the household did the majority of its food shopping. Because the researchers did not have a complete list of all supermarkets and supercenters, they used supermarkets and supercenters authorized to accept SNAP benefits as a proxy for the nearest supermarket or supercenter. The distance to the nearest supermarket or supercenter for the average U.S. household was 2.14 miles and that average household primarily shopped at a store 3.79 miles from home.
The average SNAP participant lived 1.96 miles from the nearest supermarket or supercenter, but traveled 3.36 miles to their primary food store. These findings are consistent with previous studies that found that SNAP households do not necessarily shop at the nearest supermarket. Food-insecure households and WIC participants also bypassed the supermarket or supercenter closest to them and traveled 2.92 miles and 3.15 miles, respectively, to their primary stores for grocery shopping.
People who use someone else’s vehicle for their primary food shopping travel an average of 3.43 miles to their primary store, despite living 1.9 miles from a supermarket or supercenter. Even those who walk, use a bike, or take public transit for their food shopping choose a primary store that is farther away than the nearest supermarket or supercenter. People using these other transportation modes lived an average of 0.5 miles from a supermarket or supercenter, but traveled 0.92 miles to the primary store. These results suggest that store proximity may be important, but price, quality, and selection—and maybe the need to combine grocery shopping with a commute from work or school—also affects where households shop for food.
Implications of Different Travel Modes for Food Shopping
Data from USDA’s new FoodAPS survey provide insights into where low-income Americans shop for food and how they travel to those stores. While most consumers—both low income and higher income—do their main grocery shopping at supermarkets and supercenters, how they travel to those stores can differ. ERS analysis of FoodAPS data found that about a third of SNAP participants and food-insecure households used someone else’s car, or they walked, biked, or used public transit for their primary food shopping. Only 5 percent of higher income consumers used these travel modes for their main food shopping. Walking, biking, and taking a bus can be more time-consuming and can limit the amount and types of groceries that can be purchased.
Borrowing someone else’s car or sharing a ride to a store is likely to mean less frequent trips to the grocery store. Another analysis by ERS using data from the National Health and Nutrition Examination Survey (NHANES) found that 28 percent of SNAP participants indicated they made their major food shopping trips just once a month or less frequently compared to 8 percent of those with incomes above 185 percent of the poverty threshold. Seventy percent of SNAP participants rated “how well food keeps” as being very important to them in their food shopping selections—the second most highly rated attribute, and ahead of price, nutrition, and convenience. Less frequent shopping has implications for menu planning and food choices. Healthy food shopping strategies may need to be adjusted for the shopping realities of low-income shoppers. Continued exploration of the FoodAPS data by ERS researchers and others will assist with these efforts.
FoodAPS Fills Data Gaps
USDA’s National Household Food Acquisition and Purchase Survey (FoodAPS) was designed to fill a critical data gap and support research to inform policymaking on key national priorities, such as health and obesity, hunger, and nutrition assistance policy. The bulk of economic research in these areas has had to rely on individual-level dietary recall data, consumer expenditure surveys, retail store purchase data, or in some cases, changes in national supplies of specific commodities. However, these data sets do not provide a complete picture of the way in which food prices, local food environments, and participation in USDA’s nutrition assistance programs affect the amount and types of foods that households purchase or acquire for free. These data sets do not allow researchers to assess the extent to which low-income households rely on alternative sources, such as food pantries or relatives, to supplement tight budgets.
While dietary recall data provide detailed information on what individuals consume and the nutritional quality of those foods, there is no information on food prices or food access. Consumer expenditure surveys typically lack detail on the form in which foods are purchased, and there is little information on the food items that are purchased away from home. Retail purchase data, which provides detailed information of food items and their prices, tend to underrepresent lower income households. These data also lack information on food away from home purchases and those acquired for free.
To provide a more detailed and complete picture of the set of factors that influence consumer food choices, FoodAPS collected information about quantities, prices, and expenditures for the foods and beverages purchased by all household members from grocery stores and other food retailers (food at home) and from restaurants, fast food places, and other eating places (food away from home). Detailed information was also collected about foods acquired for free such as from schools, community food pantries, and gardens. Purchases and acquisitions were recorded over the course of 7 days.
The main food shopper or meal planner provided information about the household and individuals through two in-person interviews. These interviews collected demographic and other information likely to influence decisions about what to purchase and what to eat—including income, participation in various food and nutrition assistance programs, non-food expenditures, health status, and diet and nutrition knowledge.
To shed light on the extent to which local food environments shape food choices, FoodAPS also includes a geography component, with the locations of different types of food stores in a 20-mile radius from each respondent’s home, the location and type of restaurants within a 1-mile radius from each respondent’s home, time and distance measures of access to these stores and restaurants, and the prices charged at each of these venues.
Another way in which FoodAPS is unique is that it oversampled lower income households, particularly those that participate in USDA’s Supplemental Nutrition Assistance Program (SNAP). This provides a total picture of the foods and beverages purchased and acquired by households of all income levels, and also allows a deeper look at populations sometimes overlooked by private market research companies.
To get a better sense of how the distribution and levels of SNAP benefits influence food choices, FoodAPS includes information on the dollar value and receipt date of SNAP benefits for each SNAP participating household during the interview period. Administrative data on SNAP participation were also linked to the survey responses to improve the quality of collected data.
To assess how food prices, local food environments, and program participation influence nutritional quality of food purchases and acquisitions, FoodAPS also contains information on the nutritional content of items purchased and acquired, such as caloric content, sodium levels, and servings of whole grains.
More information about the survey, data collection, and data releases can be found at: http://www.ers.usda.gov/data-products/foodaps-national-household-food-acquisition-and-purchase-survey.aspx
Where Do Americans Usually Shop for Food and How Do They Travel To Get There? Initial Findings from the National Household Food Acquisition and Purchase Survey, by Michele Ver Ploeg, Lisa Mancino, Jessica E. Todd, Dawn Marie Clay, and Benjamin Scharadin, ERS, March 2015
SNAP Households Must Balance Multiple Priorities To Achieve a Healthful Diet, by Lisa Mancino and Joanne Guthrie, USDA, Economic Research Service, November 2014