

Food Price Transmissions From Farm to Retail
Providing forecasts of the prices consumers will face in the grocery store is one of ERS’s most visible food price research activities. In 2013, ERS expanded its Food Price Outlook forecasts to include projections of the Producer Price Index (PPI) for a select group of farm commodities, food products, and wholesale commodities. Since the PPI can provide an early indication of changes in retail food prices, it has long been an integral input to ERS’s forecasting model. Forecasts for 13 specific PPI categories are now published each month.
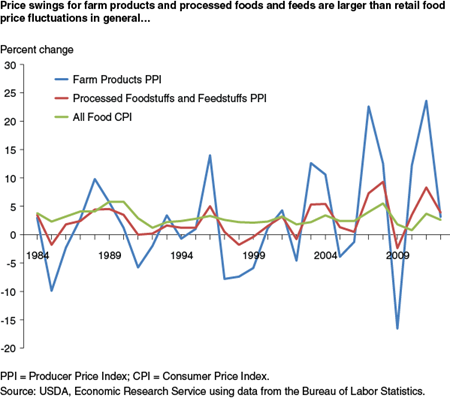
The PPI measures the average change in prices paid to domestic producers for their output through each stage of production. The aggregate PPI, published by the U.S. Bureau of Labor Statistics, is compiled from data covering nearly every industry that produces goods. The PPI sub-indices for farm products and processed foods and feeds are of particular interest to the food sector; the Farm Products PPI measures the annual percent change in the prices paid to farmers for their commodities, while the Processed Foodstuffs and Feedstuffs PPI measures the change in prices paid to food processors for their products.
A picture of the price transmission process—how price changes for inputs are transmitted to prices for final products—emerges when annual price fluctuations for farm and wholesale food products are compared with retail price inflation, as measured by the Consumer Price Index (CPI) for All Food. Overall, prices for these intermediate and final goods move in the same direction, but the price changes vary in size. For instance, in 2011 the Farm Products PPI rose by 23.6 percent, while the Processed Foodstuffs and Feedstuffs PPI increased by 8.3 percent and the CPI for All Food by 3.2 percent.
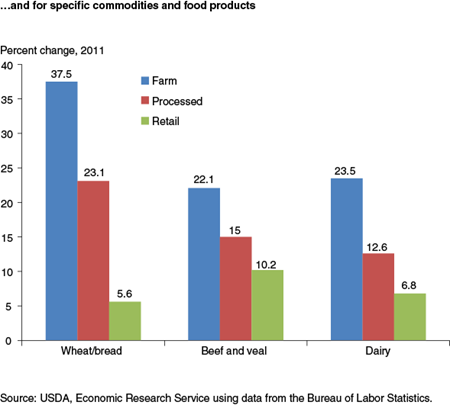
The disparity in the size of the price swings across the three stages of production also holds true for food sub-categories. During that same year, the price of wheat increased by 37.5 percent and wheat flour prices grew 23.1 percent, while the price of wheat bread rose by 5.6 percent. The beef and veal category and the dairy category exhibit a similar pattern.
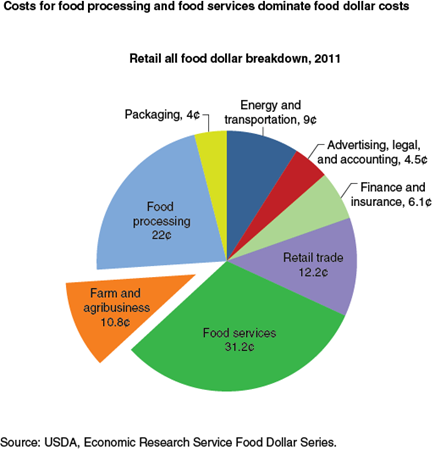
One reason for the relative stability in retail prices in relation to commodity prices is that these prices reflect the cost of processing and marketing inputs in addition to commodity costs. ERS's 2011 Food Dollar Series reports just 10.8 cents of every food dollar goes toward farm commodities and agribusiness expenses. The remainder is allotted to food processing, food service, and other administrative, transportation, and retailing costs, categories which are less volatile due to fixed machinery expenses, multi-year contracts for supplies, and small year-to-year changes in wages. Since 1990, grocery store wages—which make up over 50 percent of retailing costs—have increased an average of 2.2 percent per year.
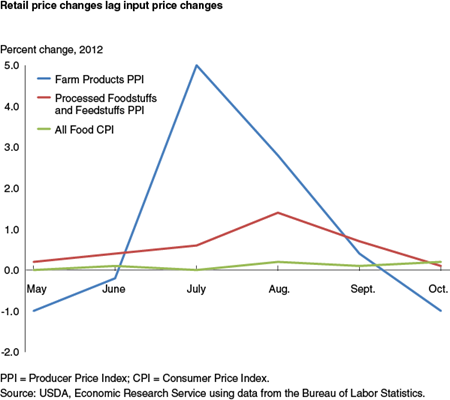
In addition to size differences, price fluctuations for the three production stages also vary in their timing. 2012 provides a good example of this variability. Examination of monthly price changes shows that in July 2012 the Farm Products PPI increased by 5 percent, an increase which was not seen in the retail stage until August and at a much lower level, when the CPI for all food climbed by 0.2 percent. The lag suggests that retailers and restaurateurs are sometimes slow to pass input costs along to consumers through higher prices, which can cause margins to narrow during times of higher commodity price inflation. Delayed price transmission in grocery stores can occur for a variety of reasons, including re-pricing costs (such as printing new shelf price labels) and concerns that input price changes are only temporary. A 2011 ERS study found that retail prices for bread and beef generally respond to changing commodity prices within 1 to 6 months. However, lags for some foods such as eggs and milk are at the upper end—5 to 6 months.
More information on food prices and ERS’s forecasts can be found in ERS’s Food Price Outlook data product.
Food Price Outlook, by Matthew MacLachlan and Megan Sweitzer, USDA, Economic Research Service, March 2024
How Retail Beef and Bread Prices Respond to Changes in Ingredient and Input Costs, by Edward Roeger and Ephraim Leibtag, USDA, Economic Research Service, February 2011