

Trends in U.S. Per Capita Consumption of Dairy Products, 1970-2012

Dairy products make important contributions to the American diet. They provide high-quality protein and are good sources of vitamins A, D, and B-12, as well as riboflavin, phosphorus, magnesium, potassium, zinc, and calcium. The 2010 Dietary Guidelines for Americans and the supporting MyPlate Food Guidance System recommend that Americans consume 2-3 cups of dairy products daily, depending on their age, gender, and level of physical activity. Despite these recommendations, per capita consumption of dairy products totaled 1.9 cups per day in 2012. While consumption of some dairy products—cheese, yogurt, and sour cream—has risen since the 1970s, declining milk consumption has caused total pounds of dairy products available to eat or drink annually to fall from 339.2 pounds per person in 1970 to 275.9 pounds in 2012.
| 1970 | 1980 | 1990 | 2000 | 2012 | |
|---|---|---|---|---|---|
| Fluid milk and cream | 273.8 | 245.0 | 232.8 | 209.9 | 198.8 |
| Butter | 5.4 | 4.5 | 4.4 | 4.5 | 5.6 |
| Cheese and cottage cheese | 16.4 | 21.9 | 27.9 | 32.5 | 36.0 |
| Frozen dairy products | 25.8 | 23.9 | 26.1 | 28.1 | 23.9 |
| Evaporated and condensed milk and dry dairy products | 17.7 | 10.5 | 11.6 | 9.0 | 11.6 |
| Total | 339.2 | 305.8 | 302.8 | 283.9 | 275.9 |
| Note: Values are per capita availability (pounds) Source: USDA, Economic Research Service, Food Availability (Per Capita) Data System. |
|||||
ERS’s food availability data calculate the annual supply of a commodity available for humans to eat by subtracting measurable nonfood use (farm inputs, exports, and ending stocks) from the sum of domestic supply (production, imports, and beginning stocks). Per capita estimates are determined by dividing the total annual supply of the commodity by the U.S. population for that year. Although these estimates do not directly measure actual quantities ingested, they serve as a proxy for Americans' food consumption over time.
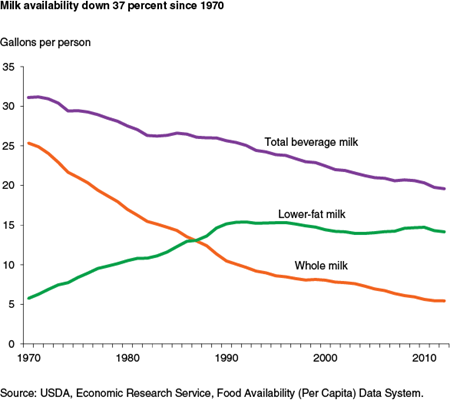
Whole Milk Consumption Falling, Low-Fat Milk Consumption Steady
The bulk of the 63-pound decline in U.S. dairy availability between 1970 and 2012 stems from the decrease in fluid milk and cream availability, which decreased 75.1 pounds per person (9.2 gallons per person). Since fluid milk availability peaked at 42.3 gallons per person in 1945, availability has steadily fallen, reaching a record low of 19.6 gallons per person in 2012. Whole milk availability dropped to 5.4 gallons per person in 2012, almost a quarter of 1970’s 25.3 gallons. In addition, lower fat milk availability has leveled off to an average of 14 gallons per person since 1998.
A 2013 ERS study found that while Americans continue to drink about 8 ounces of fluid milk when they drink milk, they are consuming it less frequently than in the past. Americans are especially less apt to drink milk at lunchtime and with dinner. National food consumption surveys reveal that Americans born in the early 1960s drank milk 1.5 times a day as teenagers, 0.7 times a day as young adults, and 0.6 times a day in middle age. In contrast, Americans born in the early 1980s entered their teenage years drinking milk just 1.2 times a day and were drinking milk 0.5 times a day as young adults. Competition from other beverages—especially carbonated soft drinks, fruit juices, and bottled water—is likely contributing to the changes in frequency of fluid milk consumption. In addition, substitutes for cow’s milk (including nut milks, coconut milk, and soy milk) have provided alternatives for consumers.
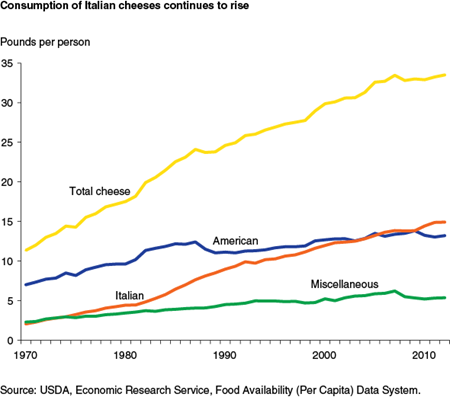
Americans Eating More Cheese and Fewer Frozen Desserts
Over the last four decades, Americans have increased their consumption of cheese, especially Italian varieties such as mozzarella, parmesan, and provolone. In 2012, cheese availability was 33.5 pounds per person, almost triple the amount in 1970 at 11.4 pounds. Availability of Italian cheeses increased to 14.9 pounds per person from 2.1 pounds in 1970. Since 2005, availability of American cheese has remained around 13 pounds per person. The inclusion of cheese in time-saving convenience foods and in commercially manufactured and prepared foods such as frozen pizza, macaroni and cheese, and pre-packaged cheese slices has increased consumption. The popularity of cheese-rich Italian and Tex-Mex cuisines has also contributed to increased cheese consumption.
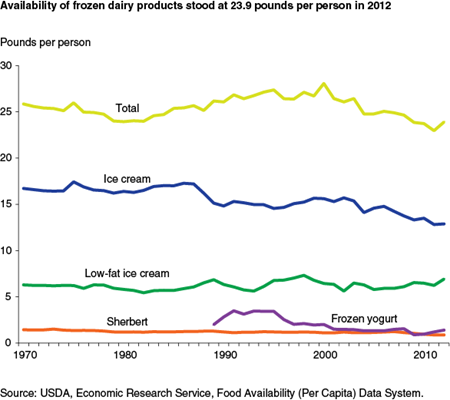
U.S. availability of ice cream has declined since its peak of 22.7 pounds in 1946. Despite the multitude of offerings in the ice cream aisle, ice cream availability has fallen to 12.9 pounds per person in 2012, down from 16.7 pounds in 1970. Availability of low-fat ice cream (formerly known as ice milk) has remained relatively constant from the late 1960s, fluctuating between 5 and 7 pounds per person. Frozen yogurt availability is down from an average of 3.4 pounds in the late 1990s to 1.4 pounds in 2012.
Food Availability (Per Capita) Data System, by Linda Kantor and Andrzej Blazejczyk , USDA, Economic Research Service, April 2023
Why Are Americans Consuming Less Fluid Milk? A Look at Generational Differences in Intake Frequency, by Hayden Stewart, Diansheng Dong, and Andrea Carlson, USDA, Economic Research Service, May 2013