

Farm Businesses Well-Positioned Financially, Despite Rising Debt

Highlights:
-
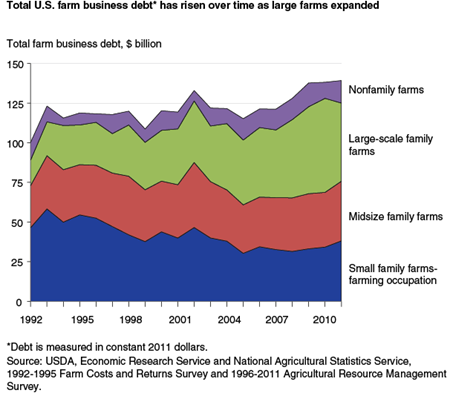
Debt owed by U.S. farm businesses rose 39 percent between 1992 and 2011, after adjusting for inflation.
-
Despite rising debts, financial leverage—measured as debt relative to the value of assets—declined over this period for the typical farm business.
-
Debt use and financial leverage varies widely, but the vast majority of farm businesses are better positioned to withstand unexpected changes in farm income or interest rates than they were in the 1990s.
Farm businesses’ borrowing decisions can affect their growth and survival, as well as the economic vitality of farm-dependent rural communities. During the early 1980s, farm income plummeted and interest rates rose rapidly, leaving many farm businesses that relied on debt to finance their operations over-extended. The resulting jump in farm bankruptcies and rural bank failures had widespread detrimental effects on many rural communities. Today, the farm sector overall is in a strong financial position after several years of generally rising income and historically low interest rates. However, the potential for lower income and higher interest rates in the future has raised concerns about recent growth in farm business debt.
USDA’s Farm Costs and Returns Survey (1992-95) and Agricultural Resource Management Survey (1996-2011) provide data on farm business debt over the past two decades, as well as on how debt use varies by farm size, specialization, and other characteristics such as operator age and the extent to which the farm business is leveraged. Researchers focused on the roughly 900,000 farms operated as farm businesses based on their size, organizational structure, or the occupation of their principal operator. While they represent less than half of all U.S. farms, farm businesses held roughly 80 percent of the sector’s total farm debt and accounted for over 90 percent of the sector’s total value of production over the past 20 years. Total debt held by farm businesses increased 39 percent from 1992 to 2011 after adjusting for inflation. Nonetheless, the broad uses for farm business debt remained remarkably stable, with the majority (roughly 60 percent) used to purchase farm real estate or secured with a lien on real estate. The remainder was short-term debt (lasting less than 1 year) and medium-term debt (lasting more than 1 year) used to purchase farm inputs (such as seed, fertilizer, fuel, and labor) and equipment.
Farm businesses can be categorized by their size and ownership (see table below), what they produce, and a range of other characteristics. Reliance on debt varies significantly among these categorizations, both at any given point in time and over time, reflecting production decisions, business and farm operator goals, and commodity and credit market conditions.
| Farm business category* | Annual gross cash farm income | Farm operators’ primary occupation |
|---|---|---|
| Small family farms | Less than $350,000 | Farming |
| Midsize family farms | Between $350,000 and $1,000,000 | No requirement |
| Large-scale family farms | Greater than $1,000,000 | No requirement |
| Nonfamily farms | No requirement | No requirement |
| *Family farms include any farm where the majority of the business is owned by the operator and individuals related to the operator. Nonfamily farms are all other farms, including partnerships of unrelated operators where none of the partners holds a majority of the farm or farms operated by a hired manager. Annual gross cash farm income is measured in constant 2011 dollars. For more information, see Hoppe and MacDonald (2013). Source: USDA, Economic Research Service and National Agricultural Statistics Service; 1992-1995 Farm Costs and Returns Survey and 1996-2011 Agricultural Resource Management Survey. |
||
Debt by Type of Farm Business
After adjusting for inflation, the amount of debt owed by all but small family farms increased over the past two decades, but the increase was particularly noticeable for large-scale family farms. The share of farm business debt held by large-scale family farms increased from 16 percent in 1992 to 35 percent in 2011. Over the same period, the share of debt held by small family farms with a farming occupation declined from 46 percent of all farm business debt to 27 percent. These shifts largely reflect changes in large and small farm production over this period. In 1992, small family farms accounted for 35 percent of the value of production of farm businesses while large-scale family farms contributed only 24 percent. By 2011, these shares had reversed, with large-scale family farms contributing 37 percent and small family farms 20 percent of the total value of production by farm businesses.
The shift in production toward larger farms not only changed the distribution of farm debt, but may have also contributed to its growth, as larger farms use debt financing more than smaller farms. A farm’s debt-to-asset ratio measures the degree to which farm assets are financed by debt. Higher debt-to-asset ratios indicate a higher reliance on borrowed funds. The average farm business debt-to-asset ratio was 0.13 in 1992, rose to 0.15 in 1997, but declined to 0.09 by 2011. This pattern of reduced financial leverage was fairly widespread, with debt-to asset ratios declining on average for all farm business size categories over this period.
Debt Use by Farm Business Commodity Specialization
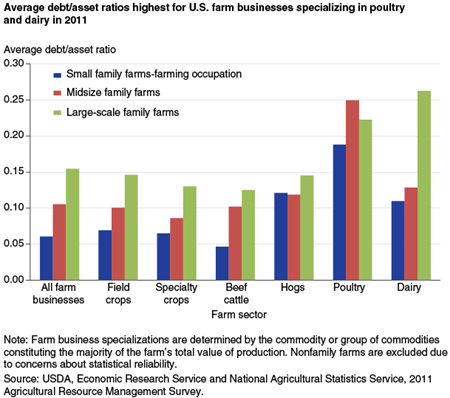
Different farm commodity specializations have different financing requirements, so their debt use varies significantly. Dairy and poultry farm businesses are generally more leveraged than farm businesses specializing in the production of other commodities. These specializations generally face higher capital costs (such as building poultry houses or milking parlors) which contribute to increased debt use. Crop farm businesses likely benefited the most from increasing farmland values, as reflected in their relatively low debt-to-asset ratios. Beef cattle farm businesses have lower average capital investments than other livestock farms, which might contribute to their relatively low debt-to-asset ratio.
Farm Business Debt by Operator Age
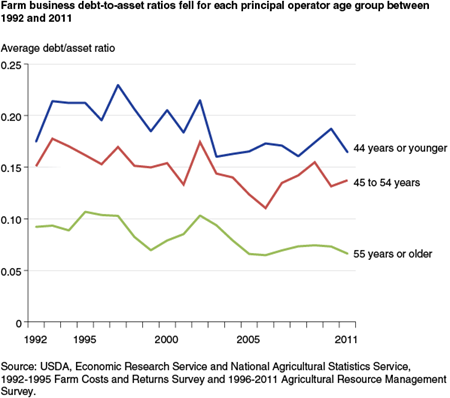
The aging of the farm operator population may also be contributing to declining average farm business debt-to-asset ratios, as financial leverage tends to decline as farm business operators age. Between 1992 and 2011, the share of farm business principal operators under 45 years old declined from 30 percent to 13 percent. Over the same period, the share of principal operators 55 years or older increased from 48 percent to 68 percent. Young operators can use debt to expand their farm operation, adopt new technologies, and improve competitiveness and profitability. Older operators are more likely to have paid off farm debts and are less likely to take on new debt as they approach retirement. In addition, older farmers tend to own more of the land they operate, so appreciating farmland values have had a greater impact on the value of their assets relative to those of younger farmers who often rent more of the land they operate. As fewer young operators enter farming and older farm operators remain active past retirement age, the need for additional debt and the debt-to-asset ratio of the typical farm business tends to decline.
Contributions to Value of Production by Highly Leveraged Farm Businesses
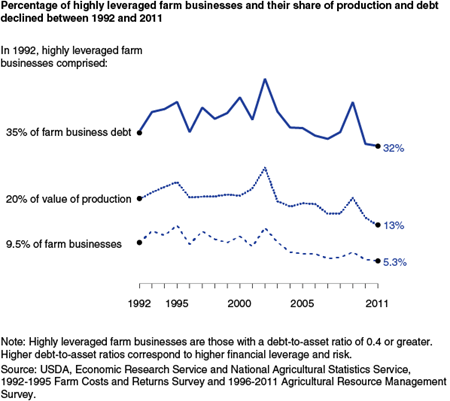
While the average leverage of farm businesses—as measured by debt-to-asset ratios—has decreased over time, there are still some farms that are highly leveraged. The debt-to-asset ratio that implies financial vulnerability varies with individual farm business characteristics, but a commonly used threshold to indicate high leverage is a debt-to-asset ratio greater than 0.4. The share of highly leveraged farm businesses and their contribution to the total value of production indicate the vulnerability of the farm sector to debt-induced disruptions in production. Declines in the share of the value of production attributed to highly leveraged farm businesses have largely been proportionate to the declines in the number of farm businesses with high leverage. Between 1992 and 2011, farm businesses with a debt-to-asset ratio greater than 0.4 had an average value of production that was consistently more than twice the average for all farm businesses. In 2011, 5.3 percent of farm businesses had a debt-to-asset ratio greater than 0.4 and contributed 13.4 percent of farm businesses’ total value of production; by comparison, in 1992, 9.5 percent of farm businesses, responsible for 19.6 percent of production, were highly leveraged. The declining role of highly leveraged farms suggests the sector’s financial resiliency has increased over time because financial shocks—such as an unexpected drop in income or a sudden jump in interest rates—would likely affect the viability of highly leveraged farm businesses to a greater degree than farms with little or no debt.
Farm Business Financial Health Going Forward
Average leverage has declined across most farm categories over the past 20 years, as have the share of farms that are highly leveraged and their share of total farm business value of production. While older operators and crop farms are more likely to have benefited from increasing farmland values, livestock farms were also less leveraged in 2011, on average, than they were in 1992. Younger operators, large-scale family farms, and dairy and poultry farm businesses currently have the highest average debt-to-asset ratios. It is these farms that are at highest risk of debt repayment problems if farm income declines or interest rates increase. Nonetheless, most farm businesses appear to be well positioned to withstand such shocks.
Debt Use by U.S. Farm Businesses, 1992-2011, by Jennifer Ifft, Amirdara Novini, and Kevin Patrick, USDA, Economic Research Service, April 2014
ARMS Farm Financial and Crop Production Practices, by ARMS Team, USDA, Economic Research Service, December 2023
Farm Income and Wealth Statistics, by Farm Income Team, USDA, Economic Research Service, February 2024
Updating the ERS Farm Typology, by Robert A. Hoppe and James M. MacDonald, USDA, Economic Research Service, April 2013