

Eating Better at School: Can New Policies Improve Children’s Food Choices?
Highlights:
-
ERS research found that offering school lunches with a healthier mix of vegetables was associated with higher consumption of healthier vegetables, but also higher food costs.
-
Behavioral economics experiments suggest that “nudges” can encourage increased acceptance of healthier foods by children and teens.
-
New standards for “competitive” school foods that are not part of USDA meals have raised concerns over lost revenues from sales of these foods; an ERS study found that revenues from competitive foods were not uniform across school districts.
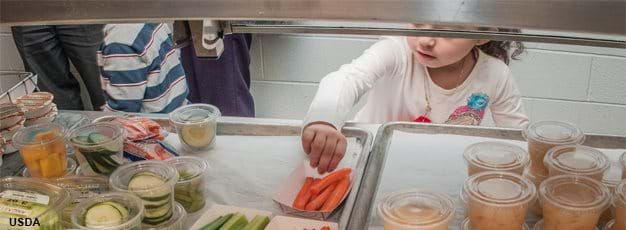
As students return to school in 2013-14, school cafeterias across America will be entering their second year of serving healthier USDA school lunches based on updated nutrition standards that feature whole grains, low-fat milk, more fruit, and a healthier mix of vegetables. They will begin implementing new breakfast standards that similarly improve the nutritional quality of breakfasts.
Besides USDA meals, most U.S. schools also sell other foods and beverages, often referred to as “competitive foods” because they compete with the USDA meal for student purchases. Competitive foods include à la carte cafeteria items like pizza, french fries, and ice cream, as well as vending items or foods sold at snack bars, school stores, or other locations. By the 2014-15 school year, competitive foods will be subject to new nutritional standards, too.
Together these new standards are aimed at creating a healthier school nutrition environment, but these changes do come with challenges. While school foodservice operations are nonprofit, they are generally expected to balance their budgets, and changes in lunch and breakfast standards may increase food and labor costs. And, to succeed in improving children’s diets, meals must not only be healthful but also appealing so that healthy foods are eaten, not wasted. The new standards for competitive foods raise concerns about the lost revenues from potentially smaller sales of competitive foods.
Some Changes Raise Food Costs
Nutrition standards for meals served through USDA’s National School Lunch Program (NSLP) and School Breakfast Program (SBP) were updated in January 2012 to be consistent with the Federal Dietary Guidelines for Americans. New meals feature more servings of fruits and vegetables; offer a healthy variety of vegetables, including dark green and red/orange vegetables (like tomatoes, carrots, and sweet potatoes); contain more whole grains; and limit milk to low-fat milk and fat-free options (see “Highlights of New Standards for School Lunches and Breakfasts”). To address the potentially higher costs of these new standards, USDA provides an additional 6 cents per lunch served to schools meeting the standards. (For school year 2013-14, USDA will pay schools $2.93 per lunch served free and $2.53 per lunch served at a reduced price to low-income students and $0.28 for full-price lunches.)
To better understand the potential effect of new standards on lunch costs, a 2012 ERS study analyzed data from the two most recent nationally representative surveys of school meal programs. The School Nutrition Dietary Assessment Data III (SNDA-III) provides information on the nutritional content of the lunch items offered to students in 2005, and the School Lunch and Breakfast Cost Study II (SLBCS-II) provides data on food costs by food type in the 2005-06 school year. Although new standards were not in place, some schools were already offering meals that incorporated elements of the standards, making it possible to compare food costs of schools serving more of such healthy items as dark green vegetables with food costs of schools not meeting the standards.
Overall, food costs averaged $1.04 per lunch in 2005. The estimated food costs of offering school lunches that met the combined 2011 proposed standards for dark green vegetables, orange vegetables, other non-starchy vegetables (green beans, iceberg lettuce, etc.), low-fat/fat-free milk, and fruit averaged 8.5 cents more per meal in 2005 dollars when other factors that could affect food costs (for example, school location or whether a school offers à la carte items) were taken into account. (Nonfood costs associated with new meal standards, such as labor, were not assessed, although they may also be affected.) The main source of the higher food cost was offering a healthier mix of vegetables, which by itself raised costs 9.4 cents per meal. On the other hand, offering meals in line with the new calorie standard (a maximum and minimum calorie level) lowered food costs by 8.8 cents per meal.
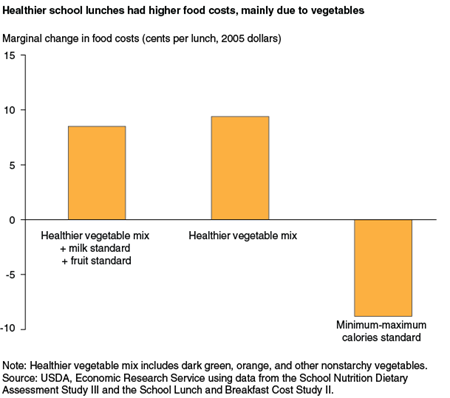
The final standards differ somewhat from proposed standards—most notably, red and orange vegetables are combined as a vegetable subgroup. Also, the new standards may have created incentives for food companies to offer some healthy items at more competitive prices. Thus, costs in 2013 to meet the new standards may differ from study results.
Will Students Eat the Healthier Items?
Along with concerns about cost, some question whether children will eat the increased servings of fruit and vegetables, especially the nutrient-dense dark green and red/orange vegetables and legumes (dried beans and peas) emphasized in the new standards. A recent ERS study examined student acceptance of nutritious NSLP foods using data from the SNDA-III that document what foods were offered to students as part of school meals and also what foods they actually ate. Even though the data were collected in 2005, before the adoption of new standards, some schools were already offering fruits and vegetables in amounts and varieties that would become required in 2012. In the ERS study, food intake data for a sample of 1,442 students who ate school lunches in 242 schools were matched by date to lunch menu records for the same day to examine whether students who were offered more fruits and vegetables actually ate them. Intakes of fruit, total vegetables, dark green vegetables, red/orange vegetables, legumes, and other nonstarchy vegetables were examined.
After controlling for a number of student and school foodservice characteristics, serving more fruits and a healthier mix of vegetables did increase students’ vegetable consumption significantly, although average amounts consumed were still small. For example, in schools that offered more orange vegetables, students ate 0.03 cups of them at lunch on average, significantly higher than the 0.01 cup eaten by students in other schools but still very low.
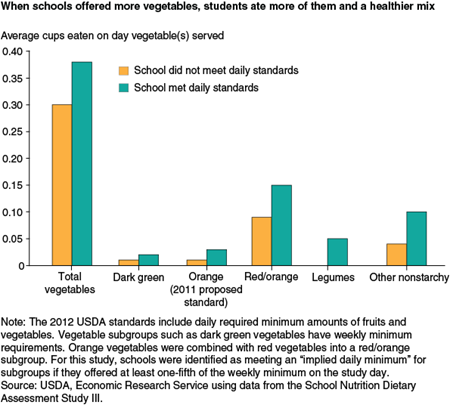
The major reason the difference in average consumption is small is that many students did not eat the healthier options at all. More students in schools that offered vegetables in amounts consistent with new standards ate at least one kind of vegetable, 81 percent, compared with 70 percent in other schools. In both groups, the majority of students ate at least some amount of red/orange vegetables, a group that includes tomato and tomato products, a popular choice. The majority did not eat any dark green and orange vegetables or legumes, although more students in the schools meeting requirements did eat some of those foods. Available alternatives mattered—students at schools that had no à la carte options, or only healthy à la carte options, had higher intakes of dark green vegetables.
For the students who did eat these foods, the healthier menus boosted intake significantly. Among those who consumed dark green vegetables, for example, mean consumption was about one-quarter of a cup. In contrast, a previous ERS analysis estimated that in 2003-04, Americans age 2-19 consumed only 0.04 cups of dark green vegetables daily, from all sources. These results suggest that the new meal standards likely have already improved the diets of some students. To fully realize these benefits, however, more students will need to eat these healthy foods.
Nudging Students Can Increase Acceptance
The field of behavioral economics marshals experimental psychology and economic research to demonstrate how individuals make choices—with results that can be applied to improving acceptance of healthy school meals. Key to influencing behavior is the way that choices are presented. In a rushed, distraction-filled environment such as a school cafeteria line, choices that are more convenient and attention getting are more likely to be selected, and simple “nudges” can pay dividends.
A series of experiments have tested the application of these ideas to school meal choices, identifying effective, low-cost strategies for improving nutrition. ERS-funded researchers at Cornell University's Center for Behavioral Economics in Child Nutrition Programs converted one high school lunch line into an express line that offered only healthy options, resulting in a 21-percent increase in the purchase of healthy items. In several elementary schools, the researchers tested the effect of giving attractive or fun names, such as “X-ray Vision Carrots,” to vegetables and found children were more likely to select and eat those foods. Yale University researchers found that a simple verbal cue—asking students “Would you like fruit with your lunch?”—increased fruit selection and consumption.
A related project at the Cornell Center developed a group of “smarter lunchroom” strategies that increase the convenience and attractiveness of the fruits and vegetables offered through the school meal program, while also providing promotional nudges to encourage healthy choices. For example, salads were served in see-through to-go containers, while fresh fruit was displayed in tiered stands on the cafeteria line and also placed in a basket near the cash register with a sign “Last Chance for Fruit,” prompting students who had not taken fruit before. When the “smarter lunchroom” strategies were implemented in a middle and high school, students ate significantly more fruits and nonstarchy vegetables (starchy vegetables include potatoes, corn, etc.). In 2012, USDA’s Healthier U.S. School Challenge incorporated “smarter lunchroom” guidelines into its criteria for school foodservice excellence.
Competitive Foods Will Be Changing, Too
Competitive foods that schools sell in addition to USDA school meals are currently little regulated and are frequently high-calorie, low-nutrient options. Most competitive foods are sold in vending machines and as à la carte items in the cafeteria line, but they may be sold in other locations such as a school store. Some child health advocates argue that the presence of these competitive foods undermines efforts to promote a healthier school environment.
In addition to updated standards for school meals, the Healthy, Hunger-Free Kids Act of 2010 required that schools that offer the USDA school meals only sell other foods that meet nutrition standards based on the Dietary Guidelines for Americans. In June 2013, USDA’s Food and Nutrition Service issued nutrition standards that limit the calorie, fat, sodium, and sugar content of competitive foods. The standards also require that the foods offer positive nutritional value, in terms of one of the basic MyPlate food groups or an important, underconsumed nutrient such as calcium. Standards for competitive beverages limit calories, sugars, and fat (see box, “Changes Are Coming to Competitive Foods”).
Standards apply to all foods and beverages sold outside the school meals programs on school campuses at any time during the school day, with exemptions for occasional school-sponsored fundraisers. In many schools, booster clubs and other groups sell competitive foods in vending machines or as fundraisers to fund school activities. Although competitive food standards will apply to these groups, the legislation allows them to sell foods that do not meet standards on a limited number of occasions. Schools will have until the beginning of the 2014-15 school year to implement the new standards.
SNDA-III data indicate that in 2005, 40 percent of students ate at least one competitive food item on a typical school day. ERS researchers found that secondary (middle and high) school students were much larger consumers of these foods. One-third of elementary students consumed at least one competitive food on a typical school day in 2005, whereas 53 percent of secondary students did. Secondary students also consumed twice as many competitive items as did elementary students. The most popular items were desserts, sweetened beverages, salty snacks, pizza and other entrees, and candy.
Some school foodservices are reportedly dependent on competitive food revenues and are concerned about potential revenue declines following implementation of nutrition standards. To assess the types of foodservice operations most likely to be concerned about implementation of standards, ERS researchers examined characteristics associated with higher competitive food revenues at the school level and also at the school food authority (SFA, the foodservice management unit for the school district) level. For this study, ERS researchers again used the SNDA-III data, along with the 2002-03 School Food Authority Characteristics Study (SFACS)—surveys that contain the most recent available nationally representative data on competitive food offerings, student selections, and school foodservice revenues.
Competitive food revenues were considerably higher in secondary schools than in elementary schools, which is not surprising since secondary-level students eat more competitive foods than do younger students. Average annual competitive revenues for elementary schools were just under $8,000 for 2005; revenues were six times greater for middle schools and nine times greater for high schools. Schools with high competitive food revenues served fewer NSLP meals, had fewer students receiving free or reduced-price meals, and were less likely to offer the School Breakfast Program.
SFAs reported obtaining, on average, 12 percent of revenues from competitive foods in 2002-03, a period in which there were few nutritional restrictions on competitive foods. The share of revenues from competitive foods was below average for the majority (54 percent) of SFAs because revenues were skewed. Ten percent of SFAs received 36 percent or more of their revenues from competitive foods, due both to higher competitive food revenues and lower revenues from USDA school meals.
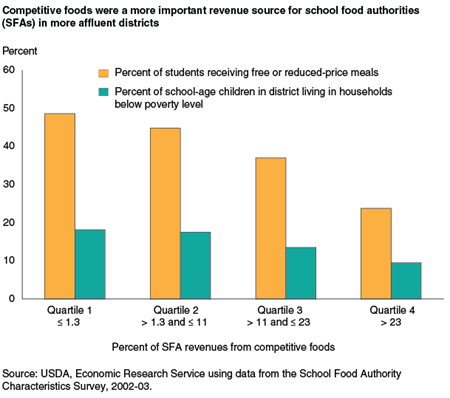
When separated into quartiles based on the share of total revenue obtained from competitive foods, SFAs with higher shares of competitive food revenue typically were located in more affluent districts and served fewer low-income students receiving free and reduced-price meals than did schools with low competitive food revenues. They also were more common in suburban, rather than urban or rural, districts and in the Northeast, Mid-Atlantic, and Midwest regions of the United States, as compared with the Southeast, Mountain, Southwest, and Western regions.
Competitive food standards could encourage manufacturers to adapt existing products—for example, by packaging juices to meet serving size requirements—and to develop new products. Or SFAs could choose to re-emphasize their “core business” by expanding participation in school meals. In California, some school districts that eliminated or drastically limited competitive foods launched efforts to improve school meal participation that offset revenue losses from competitive foods.
Moving to a Healthier School Nutrition Environment
Since many children—especially low-income students who qualify for free or reduced-price meals—eat half their daily intake at school, the potential benefits from improved school meals and healthier competitive foods on school campuses could be considerable. Unfortunately, it appears too many children are not eating some of the most healthful foods in their school meals. Balancing nutrition, acceptance, and cost in school foodservice operations is a major challenge. Innovation by the food industry to develop and promote appealing, affordable, and healthier cafeteria fare may make the task easier. Behavioral economics studies suggest that, with a little nudging, kids are more likely to try healthier foods. Eliminating less nutritious competitive foods could also encourage children to eat the new, healthier meals.
<a name='box2'></a>Changes Are Coming to Competitive Foods 1/
Foods must:
- Be a grain product that contains 50 percent or more whole grains by weight or have whole grain as the first ingredient
- Have as its first ingredient one of the nongrain major food groups: fruits, vegetables, dairy, or protein foods such as meat, beans, poultry, seafood, eggs, nuts, or seeds
- Be a combination food that contains one-quarter cup of fruit or vegetable
- Contain 10 percent of the Daily Value of calcium, potassium, vitamin D, or dietary fiber 2/
- If water is the first ingredient, the second ingredient must be one of the foods listed above
Foods must also contain:
- No more than 230 milligrams of sodium for snacks per item 3/; 480 milligrams for entrées
- No more than 35 percent of calories from fat per item. Reduced-fat cheese; seafood with no added fat; nuts, seeds, and their butters; and dried fruit/nut/seed mixes are exempted
- Less than 10 percent of calories from saturated fat per item. Reduced-fat cheese; nuts, seeds, and their butters; and dried fruit/nut/seed mixes are exempted
- No trans fat (0 grams per item)
- No more than 35 percent of weight per item as sugar. Dried fruits/vegetables with no added sweeteners and dried fruits with nutritive sweeteners required for processing and/or palatability are exempted
- No more than 200 calories for snacks and sides; 350 calories for entrées
Exemption:
- Any entrées sold as part of the USDA school meal can also be sold à la carte on the same day or the day following their use in the meal
Beverages allowed include:
- Plain water, any size
- Low-fat milk (plain) and nonfat milk (plain or flavored)
- Nutritionally equivalent milk alternatives such as soy milk
- 100 percent fruit and vegetable juices, and fruit and vegetable juices diluted by plain or carbonated water
- All beverages except water in serving sizes of no more than 8 oz per item for elementary schools and no more than 12 oz per item for middle and high schools
- Beverages and foods in elementary and middle schools must be caffeine-free
High schools only may offer (outside of meal service time and area):
- Calorie-free and low-calorie beverages (no more than 10 calories per 20 oz), including flavored waters, in serving sizes of no more than 20 oz per item
- Moderate-calorie beverages (up to 60 calories per 12 oz) in serving sizes of no more than 12 oz per item
- No ounce restriction on plain water (carbonated or uncarbonated)
- Caffeinated beverages allowed
1/ Schools have until the beginning of the 2014-15 school year to implement the standards.
2/ The nutrient criterion can be used to qualify a food for sale as a competitive item only until June 30, 2016.
3/ As of July 1, 2016, no more than 200 milligrams of sodium per item.
Fruit and Vegetable Consumption by School Lunch Participants: Implications for the Success of New Nutrition Standards, by Constance Newman, USDA, Economic Research Service, August 2013
Nutrition Standards for Competitive Foods in Schools: Implications for Foodservice Revenues, by Joanne Guthrie, Constance Newman, Katherine Ralston, Mark Prell, and Michael Ollinger, USDA, Economic Research Service, June 2013
"The Food Costs of Healthier School Lunches", Agricultural and Resource Economics Review, 41(1):12-28, April 2012, by Constance Newman
"Smarter Lunchrooms Can Address New School Lunch Guidelines and Childhood Obesity", The Journal of Pediatrics, 4:867-869, August 2013, by Andrew S. Hanks, David R. Just, and Brian Wansink
“When Nudging in the Lunch Line Might Be a Good Thing,” Amber Waves, USDA, Economic Research Service, March 2009, by Lisa Mancino and Joanne Guthrie
"The Influence of a Verbal Prompt on School Lunch Fruit Consumption: A Pilot Study", International Journal of Behavioral Nutrition and Physical Activity, 4:6 doi:10.1186/1479-5868-4-6, March 2009, by Marlene B. Schwartz