

SNAP Participation and Diet Outcomes

Highlights:
-
Increasing interest in the healthfulness of the diets of those who participate in USDA’s Supplemental Nutrition Assistance Program (SNAP) led ERS researchers to link several unique data sets to examine the effect of SNAP on the nutritional quality of adult participants’ diets.
-
The researchers found that participation in SNAP had a modest effect on diet quality: a small positive nutritional effect was counterbalanced by a small negative effect.
-
Although SNAP participants had slightly less healthy overall diets than those of low-income nonparticipants, they consumed less sodium and saturated fat.
The Supplemental Nutrition Assistance Program (SNAP) is the largest of USDA’s food and nutrition assistance programs, with approximately 47 million persons participating at a cost of $78 billion in 2012. SNAP provides eligible low-income households with resources to purchase food, and it has two major goals: to reduce food insecurity—uncertain access to enough food for active, healthy living due to lack of money or other resources—and to support nutritious diets among low-income households.
While recent research suggests that SNAP has done well at meeting the first goal, the second has recently been a focus of public concern. The growing awareness of the health consequences—and public costs—of poor diets has led some policymakers to advocate restrictions on foods that can be purchased with SNAP benefits. For example, New York City has suggested limiting sugar-sweetened beverage purchases, and officials in South Carolina and Wisconsin tried to limit purchases of unhealthy foods with SNAP benefits.
In this context, ERS researchers examined a basic question: what is the effect of SNAP on diet quality? The researchers were particularly interested in whether a change in diet could be said to be causally linked to SNAP participation, as opposed to pre-existing dietary differences that are associated with SNAP participants. The results of the analysis were somewhat mixed. While some signs point to an increase in whole fruit consumption by SNAP participants, that increase may be offset by a decrease in dark green and orange vegetable consumption. At the same time, the total difference in diets after accounting for the effects of SNAP shows that, as a whole, SNAP participants had slightly lower diet quality than eligible nonparticipants, although they fared better when it came to sodium and saturated fat consumption. Overall, the research finds that the effects of SNAP participation on diet quality are modest—a small positive effect is counterbalanced by a small negative effect.
Researchers Take Advantage of Data Partnership To Solve Research Dilemma
Previous research has found associations between SNAP participation and diet quality. However, those associations may not account for characteristics that cannot be observed. For example, SNAP participants may really value good diets and nutritious food—which is why they enroll in the program—but such preferences are not observed by researchers. If one measures the association between SNAP participation and diet quality without taking such unobserved preferences into account, one might easily overstate the beneficial effect of SNAP because participants are likely to have better diets before enrolling in SNAP anyway. Of course, the effect of SNAP could be understated just as easily if SNAP participants overall have preferences for unhealthy foods that are correlated with their willingness to enroll in SNAP. Either way, having some way to account for unobserved characteristics that are associated with both diet quality and SNAP participation is important.
This problem has been well understood for a long time, but ways to address it have been difficult to come by. ERS researchers, however, have taken advantage of data made available through a partnership with the National Center for Health Statistics to address this issue. The data comprise State-level variables that describe the policy environment with respect to SNAP receipt.
For the last 15 years, States have had considerable leeway to waive or change Federal rules that govern whether a household is eligible for SNAP benefits. For example, a few States have adopted a rule that requires SNAP participants to be fingerprinted; this extra measure of surveillance has been found to decrease SNAP enrollment. Other States have waived or relaxed the restriction on financial assets for households to be eligible for SNAP. These and other State-level policy variables, which are linked to data from four waves of the National Health and Nutrition Examination Survey (NHANES), have enabled ERS researchers to identify how likely it is that a person might enroll in SNAP independent of his or her unobserved preferences for healthy or unhealthy foods.
Healthy Eating Scores Calculated From Dietary Recall Data
The primary data used in the analysis come from the NHANES for years 2001-08 and include adults that belonged to households with incomes less than or equal to 200 percent of the Federal poverty line. Three characteristics made the data ideal for this study. First, the data contain a wealth of information about respondents’ personal and household characteristics, including income, education, marital status, household size, age, race, and ethnicity. Second, the data indicate whether or not a respondent has participated in SNAP. Third, the data include responses from a dietary recall survey, which captures everything that a respondent ate over the previous 24 hours, enabling researchers to measure dietary quality.
The foods reported in the dietary survey are transformed into an index of diet quality called the Healthy Eating Index (HEI) score. The HEI score was developed by researchers at USDA’s Center for Nutrition Policy and Promotion and the National Cancer Institute to measure diet quality in terms of conformance with Federal dietary guidance. This study assessed an individual’s adherence to the 2005 Dietary Guidelines for Americans. The HEI is the sum of scores for 12 dietary components: total fruit, whole fruit, total vegetables, dark green and orange vegetables and legumes, total grains, whole grains, milk, meat and beans, oils, saturated fat, sodium, and calories from solid fats, alcohol and added sugar (SoFAAS).
Scores for all of the food groups and oils are based on intake adequacy on a per-1,000-calorie basis. For food groups that one should be eating more of, higher scores mean higher consumption. For the moderation components, which one should eat less of—saturated fat, sodium, and calories from SoFAAS—higher scores indicate that one is eating less of those things. All in all, higher scores are better.
Each of the components is weighted according to its importance in the Dietary Guidelines. Total fruit, whole fruit, total vegetables, dark green and orange vegetables, total grains, and whole grains all have a maximum score of 5 for a total score of 30 on these six components. Milk, meat and beans, oils, saturated fat, and sodium have a maximum score of 10 for a total score of 50 on these five components. Calories from the SoFAAS group have a total score of 20. Respondents with consumption that matches or exceeds the dietary guidelines for each component get the maximum score. Those with no consumption get zero. Respondents with scores between zero and the maximum get a score that is relative to their adherence to dietary guidance—for example, eating half of the amount of whole fruit recommended gets the respondent half of the maximum score, 2.5. Total HEI reflects the sum of each of the components: the maximum total score is 100.
The researchers used two State-level policy variables to isolate the probability of enrolling in SNAP. First, they used an indicator of whether or not the State used broad-based categorical eligibility rules to determine SNAP eligibility. In most States, this rule meant that any household that was deemed eligible for State-provided cash welfare payments through the Temporary Assistance to Needy Families (TANF) program would automatically be eligible for SNAP. This was a change in policy that made it easier to qualify for SNAP. Second, researchers used an indicator of whether or not States exempted one vehicle from the asset tests to determine SNAP eligibility. For States that did not adopt this policy, eligibility for SNAP is determined not only by current income but also by assets, one of which is a car. Low-income households with cars that were worth more (that is, they were newer and more dependable) were penalized because of this restriction: relaxing the policy meant that it became easier to qualify for SNAP. These policy variables are correlated with the probability of enrolling in SNAP but are thought to have no impact on diet choices of low-income persons. So having these variables in the model enables researchers to identify the probability of enrolling in SNAP without confounding it with unobserved characteristics mentioned earlier.
SNAP Has Small Effect on Dietary Quality
The ERS study provides two findings. The first shows how participation in SNAP changed diet outcomes for those who enrolled in the program. The second shows the difference in diet outcomes between participants and eligible nonparticipants, after accounting for the effects of SNAP.
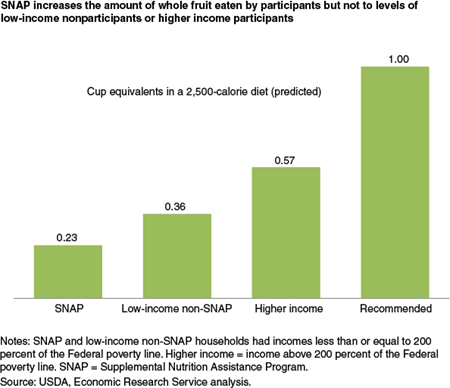
With respect to the first of these, for the most part, researchers found small, statistically insignificant effects of SNAP participation on diet quality for participants. However, there are two exceptions: whole fruit and dark green and orange vegetables. SNAP increased whole fruit consumption by about a quarter of a cup per day, while it decreased dark green and orange vegetable consumption by a little less than 1 ounce.
A closer examination of the effects for whole fruit consumption showed that the most common whole fruit score for low-income Americans and, particularly, SNAP participants is zero—that is, low-income persons on average eat no whole fruit on a given day. Given this, researchers investigated whether SNAP participation increases the probability that participants may eat any whole fruit on a given day. It turns out that the effect is large: SNAP participants are about 24 percentage points more likely to eat some whole fruit (as opposed to none) than are nonparticipants on a given day.
Even though SNAP increases whole fruit consumption by program participants, the effect may not be enough to close the gap between participants and nonparticipants. Model results based on a 2,500-calorie diet predicted that program participants would consume about a quarter cup of fruit on a given day, and low-income nonparticipants were predicted to consume a little over a third of a cup. Higher income Americans (those with incomes above 200 percent of the poverty line) were predicted to consume a little more than a half cup. None of these groups meet the recommendations of the Dietary Guidelines for Americans, which suggest that most adults consume 2 cups of fruit per day, the majority of which should be in the form of whole fruits.
In considering the other measured effect of SNAP—the reduction in consumption of dark green and orange vegetables—researchers identified two factors that may account for the change. First, SNAP participation has work requirements for able-bodied nonelderly adults: persons who are working or busy looking for work may have less time to cook, so many dark green and orange vegetables—squashes, greens, and broccoli, for example—might come with prohibitive time costs. At the same time, whole fruit, which is extremely convenient and may be regarded as a luxury on a more constrained budget, might seem more affordable and attractive to a person receiving SNAP benefits. Second, raw carrots—an orange vegetable—and whole fruit could be substitutes, so that the decreased consumption of one is compensated for by the increase in the other.
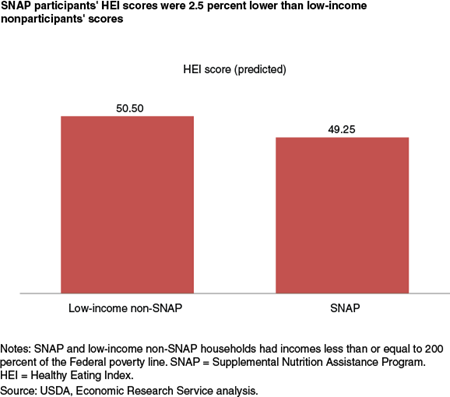
The second kind of effect was the expected differences in diet quality between SNAP participants and low-income nonparticipants. After accounting for the effect of the program on diets for participants and for unobserved characteristics that might influence both diet choices and SNAP participation, researchers found that SNAP participants had slightly lower total HEI scores than low-income nonparticipants. The deficit on the total score is 1.25 points, or about 2.5 percent of the average for this population—the equivalent of a half cup of fruit, two-thirds of a cup of vegetables, or one and one-third ounces of whole grain products.
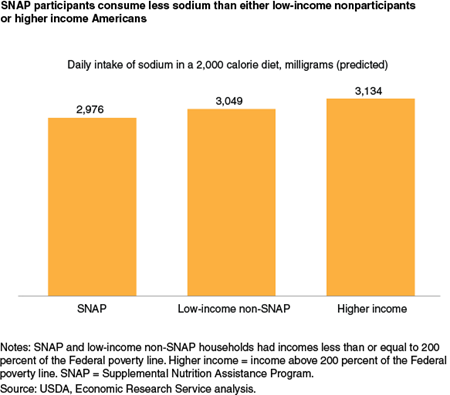
SNAP participants’ scores for several dietary components were also lower than low-income nonparticipants. SNAP participants, however, did a little better on scores for two components: they consume 73 mg less of sodium per day than nonparticipants (about half the amount in a 1-ounce bag of potato chips), and they consume about 5 percent fewer calories from saturated fat.
What Does It All Mean?
Food intake surveys reveal that the diets of most Americans, including those with higher incomes, fall short of the Dietary Guidelines for Americans, indicating the need to encourage the adoption of healthy eating behaviors by all. ERS’s analysis of whether SNAP has a positive or negative effect on SNAP participants’ diet quality showed somewhat mixed results. While there were some signs that SNAP induced participants to eat more whole fruit, other results pointed to a small decline in dark green and orange vegetable consumption. At the same time, the total difference in diets after having taken into account the effect of SNAP shows that SNAP participants had slightly lower diet quality as a whole and for many dietary components, although they do better on some components.
Could SNAP do more to encourage healthier eating and maintain the program’s effectiveness in combating food insecurity? It may be possible to reduce food insecurity while incentivizing the purchase of healthier foods, rather than restricting purchases of unhealthy foods. Several initiatives are currently exploring ways to incentivize SNAP participants to make healthier food choices. One of these projects is the recently completed USDA-sponsored Healthy Incentives Pilot, which offers SNAP participants a discount of 30 percent on fruit and vegetables by providing 30 cents of additional SNAP benefits for every dollar spent on them. Another example of the use of incentives, Wholesome Wave’s Double Value Coupon Program, uses private and public funds to increase the value of SNAP and other program benefits when used to buy fresh fruit and vegetables at participating farmers’ markets. In 2012, the program had 306 participating markets in 24 States and the District of Columbia.
Supplemental Nutrition Assistance Program (SNAP) Participation Leads to Modest Changes in Diet Quality, by Christian A. Gregory, Michele Ver Ploeg, Margaret Andrews, and Alisha Coleman-Jensen, USDA, Economic Research Service, April 2013