

Adaptation Can Help U.S. Crop Producers Confront Climate Change
Highlights:
-
While the impact that climate change will have on future growing conditions in specific areas of the country remains uncertain, the ability of farmers to adapt to climate change--through planting decisions, farming practices, and use of technology--can reduce its impact on production, farm commodity prices, and farmer returns.
-
Evidence suggests that the detrimental impacts of climate change increase modestly at the national level by 2030 under hotterand drier weather conditions; nonetheless, some regions will benefit as the geographic distribution of agricultural production shifts.
-
Changes in pest infestation that could accompany climate change will likely exacerbate the effects of changes in temperatureand precipitation, but development and adoption of drought-tolerant cultivars could benefit consumers under a wide range of adverse weather changes.
Agricultural production has always been affected by variability in weather, and U.S. farmers have adopted production practices and strategies appropriate to their local climates. The weather that shapes the current structure of U.S. agricultural production, however, is changing as global climatic conditions change. Climate models predict worldwide increases in average temperatures, with wide-ranging effects on local temperature and rainfall. Whether such changes present a risk to food supplies and farmer livelihoods depends partly on the direction, magnitude, and rate of change butalso on the responsiveness of farmers and ranchers to shifting conditions. Adaptive behaviors such as adjusting crop choices and production practices may help mitigate the negative effects of climate change and enable some producers to capitalize on new opportunities. Future developments in technology and policy are also likely to contribute to adaptive capacity.
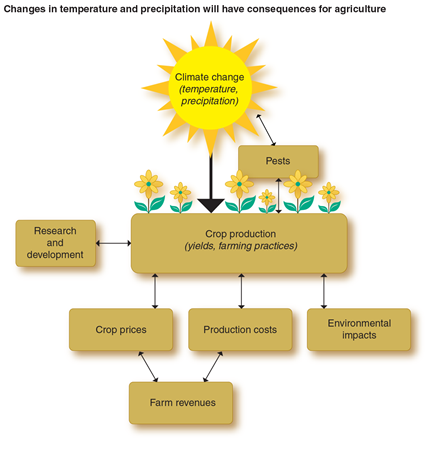
The impacts of climate change on crop growth are both complex and uncertain. Although temperature increases associated with climate change are widely expected to lower yields for crops such as corn and soybeans, shifting regional precipitation patterns can either exacerbate or offset such yield impacts. Model results suggest that the negative effects of climate-induced yield changes on crop prices, farm revenue, and the food supply can be mitigated by the ability of farmers to adapt through their crop production decisions and use of technologies. Such changes, however, may be associated with increased environmental impacts. Changes in the distribution of pests will further magnify production and revenue losses, although innovations to improve the tolerance and suitability of crops under adverse climatic conditions may help to alleviate negative outcomes.
A recent ERS study analyzes the ability of U.S. crop producers to adapt to shifting yield andproductivity patterns associated with future changes in temperature and precipitation, and the consequences of their adaptive responses for crop production and land use, crop markets, returns to producers, and water quality measures. The study employs four climate change scenarios for the year 2030, encompassing a range of projected regional changes in temperature and rainfall. The climate change scenarios are named for the climate models that produced them--ECH, CSIRO, CNR, and MIROC--with ECH projecting a future that is relatively cooler and wetter and MIROC projecting one that is relatively warmer and drier (see box, “Climate Scenarios”). The remaining two scenariosfall between these two extremes, with CSIRO generally being cooler and wetter than CNR. The analysis adjusted regional crop yields to reflect changes in monthly average temperature and precipitation under each scenario, as well as increased carbon dioxide concentration in the atmosphere. The cost per acre of producing crops for a given rotation in a specific region was held constant across climate scenarios. However, the model allows for market-mediated price changes that arise from regional shifts in crops and practices and the aggregate use of inputs change as a consequence of changes in acreage. While interactions between the crop and livestock sectors areincluded in the analysis, the reported results are confined to crop production. The limitations of the model and climate data precluded analysis of yield impacts from the potential changes due to extreme weather events.
These climate scenarios were used with a crop-growth model to estimate the effect of changing weather patterns on crop yields and on a suite of environmental indicators associated with regional production methods. A regional agricultural sector model uses the simulated crop yields under each climate scenario to estimate how production, market, and environmental outcomes differ from a baseline that assumes no climate change. The study examines both the impacts that adapting to climate change could have on agricultural returns and the possible further impacts of temperature-induced shifts in crop pest pressure. The study simulates adaptation by allowing farmers to shift crop acreage, crop rotations, and tillage practices in response to changing yield and market patterns. It also includes an analysis of the potential benefits from introducing drought-tolerant crops in water-stressed regions.
Changing Climate Affects Growing Conditions
Climate change’s expected impact on crop production varies by crop, climate change scenario, and region. Depending on the magnitude and direction of temperature and rainfall changes, some regions may see improved crop growth potential, while others may face declining yields. Though effects vary by region, acreage-weighted national average yields for corn and soybeans decline as the climate change scenarios become hotter and drier. However, wheat yields increase in the milder climate change scenarios and settle back to baseline levels in the hotter, drier scenarios.
| Region | No climate change baseline | ECH | CSIRO | CNR | MIROC |
|---|---|---|---|---|---|
| Corn yields (bushels per planted acre) | |||||
| Lake States | 158.2 | 156.82 | 161.41 | 151.12 | 134.22 |
| Corn Belt | 204.82 | 200.32 | 198.22 | 195.32 | 190.42 |
| Northern Plains | 171.61 | 176.21 | 172.71 | 153.91 | 157.71 |
| Southern Plains | 177.51 | 198.11 | 196.01 | 187.01 | 202.21 |
| U.S. | 184.2 | 184.31 | 182.22 | 175.02 | 169.92 |
| Wheat yields (bushels per planted acre) | |||||
| Lake States | 61.1 | 63.51 | 63.21 | 63.71 | 65.41 |
| Corn Belt | 67.6 | 67.71 | 66.72 | 69.11 | 66.22 |
| Northern Plains | 51.1 | 54.41 | 59.21 | 53.51 | 52.91 |
| Southern Plains | 24.8 | 24.12 | 20.92 | 21.32 | 21.42 |
| U.S. | 42.5 | 44.21 | 47.11 | 42.71 | 42.91 |
| 1Increase in realized yield from baseline. 2Decrease in realized yield from baseline. ECH = Max Planck Institute for Meteorology. CSIR = Commonwealth Scientific and Industrial Research Organization. CNR = Centre National de Recherches. MIROC = Model for Interdisciplinary Research on Climate. Source: USDA, Economic Research Service. |
|||||
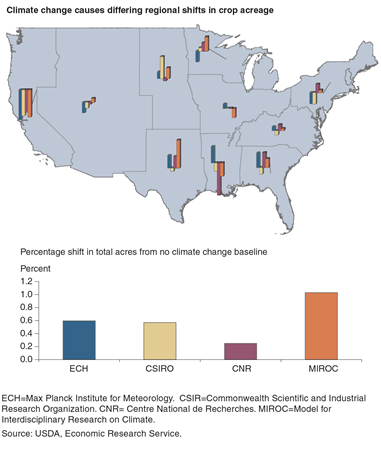
Each of the four climate change scenarios results in a small nationwide increase in total planted acreage compared with baseline levels, though the direction and size of the change varies by region. Changes in the acreage of individual crops exhibit much larger swings across climate change scenarios as each region’s farmers adjust to climate-induced changes in productivity and market prices. Even though total U.S. planted acreage increases in all scenarios, each individual region experiences declines in planted acreage under one or more climate scenarios.
Crop price changes are highly scenario-specific. The hotter, drier scenarios result in higher corn and soybean prices, whereas the milder scenarios generally result in lower prices. The cooler scenarios result in slightly higher corn yields, which put downward pressure on corn prices, increasing demand for corn as livestock feed. In the hotter climate scenarios, other feed grains substitute for higher priced corn. The price of wheat declines in all scenarios as yields either increase or remain unchanged. Soybean prices are generally more sensitive to climate change than wheat and corn prices, mainly because soybean products are less easily substituted inlivestock diets while soybean yields are more sensitive to temperature and rainfall changes.
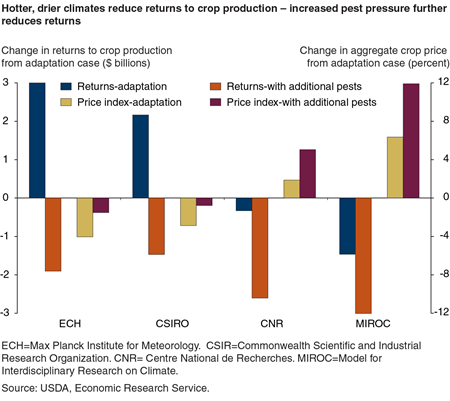
Nationally, the milder climate change scenarios are expected to increase returns while the hotter, drier scenarios will decrease returns, but effects vary across crops and regions. Projected returns in the Corn Belt decline as climate scenarios become hotter and drier, because production declines more than prices increase for corn and soybeans, the major crops of the region. The Southern Plains exhibits the least variability in crop returns across scenarios, despite relatively large swings in planted acreage. This reflects relatively higher returns to cotton production under climate change as well as the ability of farmers in the Southern Plains to increase production of corn and soybeans in the hotter and drier scenarios.
Increased Exposure to Pests Magnifies Costs of Climate Change
Changes in temperature due to climate change will make future production conditions in northern U.S. regions more similar to current production conditions in southern regions where problems with pests--especially weeds with their impacts on pesticide expenditures and yields--are much more severe. As a result, climate-induced temperature changes will lead to changes in pest populations, resulting in rising pest-control costs and pest-related yield losses that could exacerbate climate-induced changes in production patterns.
Integrating additional pest pressure into the analysis results in higher prices (relative to those predicted when pest pressures are held constant) for all climate scenarios and all crops except cotton. With pest pressure taken into account, regional and national returns to crop production are also expected to fall under all scenarios and in all regions. Returns decline more as the scenarios become hotter and drier, as a result of the combination of reduced yields, higher costs per acre, and crop prices not increasing enough to offsethigher costs. Since the presence of additional pests results in higher commodity prices, consumers are also worse off.
R&D Investments in Drought-Tolerant Crops Benefit Consumers
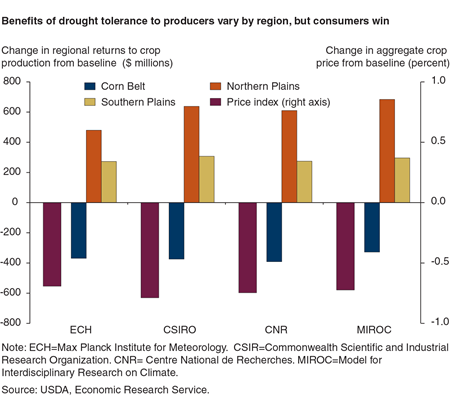
The introduction of drought-tolerant varieties increases aggregate net returns to crop production across the United States, relative to climate change scenarios without drought-tolerant cultivars. However, benefits are concentrated in low-precipitation, drought-prone regions where yields increase with the introduction of drought-tolerant cultivars. Farmers in other regions experience declines in returns as higher national production levels dampen commodity prices. Thus, while the Northern and Southern Plains benefit from the introduction of drought-tolerant varieties, returns to Corn Belt farmers fall. The change in returns to crop production is consistent across climate change scenarios, indicating that drought tolerance could be beneficial under a wide range of adverse climate changes.
The availability of drought-tolerant varieties reduces prices for corn, soybeans, wheat, and cotton in all scenarios, with wheat prices dropping the most because wheat tends to be produced in drought-prone regions. In all scenarios, prices that go up when drought-tolerant varieties are not available go up less when drought tolerance is introduced, while prices that previously declined are further reduced with the adoption of drought-tolerant varieties.
Adding drought-tolerant varieties to the model generally leads to small shifts in corn, wheat, and soybean acreages from the eastern half of the United States into the Plains and Mountain States, where drought-tolerant varieties increase yields. In contrast to the case involving additional pest pressures, lower producer returns in many regions are complemented by lower prices in the major field crops when drought tolerance is introduced, so consumers benefit.
Crop Redistribution Has Consequences for Water Quality
Climate-induced shifts in planting decisions and production practices affect the environmental impacts associated with agricultural production. Changes in total acreage together with shifts in crop production practices affect regional soil and water quality through changes in nutrient loss and soil erosion.
Adjusting acreage to adapt to climate change increases the two measures of environmental impact analyzed (sheet and rill erosion and nitrogen loss to water) across all climate scenarios, with the exception of a small decrease in sheet and rill erosion under the mildest scenario. Because acreage in production increases across all scenarios, a proportional increase in agriculture’s environmental impact might be expected if changes in planting decisions and farming practices do not change the overall intensity of production. Such a proportional change is observed for soil loss due to water erosion.
The change in nitrogen loss to water, however, is proportionately larger than the total increase in cropped acreage under all scenarios, reflecting a combination of increased nitrogen use intensity within regions and shifts in production toward regions where more severe environmental impacts are observed. In the Lake States, for example, corn acreage increases as the climate scenarios become hotter and drier, with most of the increase coming from continuous corn rotations. The Corn Belt, Northern Plains, and Southeast regions all experience increased nitrogen losses to water in all scenarios.
| Indicator | ECH | CSIRO | CNR | MIROC |
|---|---|---|---|---|
| Nitrogen loss to water (percent change from baseline) | ||||
| Adaptation | 1.41 | 1.51 | 2.11 | 5.01 |
| Pest damage | 5.71 | 5.01 | 5.21 | 6.81 |
| Drought-tolerance | 1.51 | 1.41 | 2.01 | 4.71 |
| Sheet and rill erosion (percent change from baseline) | ||||
| Adaptation | -0.92 | 0.63 | 0.93 | 1.23 |
| Pest damage | -0.82 | 1.03 | 3.33 | 4.93 |
| Drought-tolerance | -1.62 | 0.12 | 0.02 | 0.32 |
| 1Change in indicator greater than acreage change. 2Change in indicator less than acreage change. 3Change in erosion greater than acreage change but less than nitrogen loss. ECH = Max Planck Institute for Meteorology. CSIR = Commonwealth Scientific and Industrial Research Organization. CNR = Centre National de Recherches. MIROC = Model for Interdisciplinary Research on Climate. Source: USDA, Economic Research Service. |
||||
Climate Scenarios
Each of the four climate scenarios projects changes to temperature and precipitation from abaseline that represents the average historical temperature and precipitation from 1961 to 2000.The climate data used in this study were produced for the Intergovernmental Panel on ClimateChange and represent the state of the art in climate modeling. The names of the scenarios are derived from the organizations that produced the climate data. The level of temperature change varies between scenarios, with ECH (Max Planck Institute for Meteorology) and CSIRO (Commonwealth Scientific and Industrial Research Organization) showing a smaller increasein temperature for all regions of the country than the CNR (Centre National de Recherches)and MIROC (Model for Interdisciplinary Research on Climate) scenarios. The regional patternof temperature changes shows little difference between scenarios.
ECH projects a relatively wetter climate east of the Mississippi River and a slightly drier climatefor the Plains regions and Mountain States. CSIRO projects a slightly drier South and Southwest,with little change in the Northern regions. CNR shows less rainfall over much of the country,except for a wetter Northeast and Lake States. Rainfall in MIROC is reduced across the wholecountry, except for a small increase in the Pacific Northwest.
Agricultural Adaptation to a Changing Climate: Economic and Environmental Implications Vary by U.S. Region, by Scott Malcolm, Elizabeth Marshall, Marcel Aillery, Paul Heisey, Michael Livingston, and Kelly Day Rubenstein, USDA, Economic Research Service, July 2012