

Energy Development’s Impacts on Rural Employment Growth

Highlights:
-
Recent expansion of emerging energy industries—such as shale gas, wind power, and ethanol production—has been heralded for their potential to create jobs. Because of their space requirements and location of the key resource, much of the expansion in these industries has occurred in rural areas—often sparsely populated areas with few employment opportunities.
-
Research indicates that the expansion of emerging energy industries during the last decade created jobs in rural economies, but the employment impacts varied widely based on the industry.
-
Net employment gains provide a limited view of how industry growth affects life in rural communities because they do not consider other costs or benefits affecting local residents such as tax revenues or environmental effects.
A decade of higher energy prices and the expectation that high prices will persist have encouraged policymakers to promote domestic energy production. Three growing energy industries in the United States are unconventional gas—gas located in rock formations like shale that is impractical to extract with conventional methods, wind, and corn-based ethanol. From 2000 to 2010, all three industries more than doubled their output, with most of the growth occurring in rural areas with natural gas and abundant land for wind turbines and corn fields.
ERS estimates suggest that counties where these industries expanded significantly experienced net gains in employment. These estimates were derived by comparing employment growth in counties where the energy industry expanded with growth in counties with less or no expansion, while controlling for other potential differences between counties.
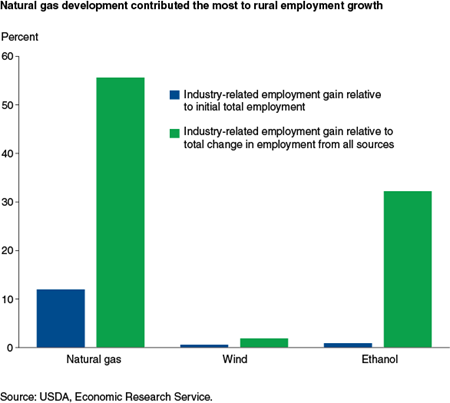
Natural gas contributed the most to short-term employment growth in these counties, while the wind and ethanol industries had much smaller effects. Gas development created 1,780 jobs in the average study county that experienced a large expansion in production, representing a 12-percent increase in employment over the 8-year study period. The corresponding effects for wind and ethanol were 59 and 82 jobs, which translate into 0.6 and 0.9 percent employment increases, respectively.
The larger employment effects for the natural gas industry primarily reflect the scale of the industry’s expansion as measured by the value of production. Over the study period, the value of natural gas production in the average gas county was $757 million − more than five times the estimated increases for the average wind or ethanol county.
| Industry | Industry growth in the average county ($ million) | Average total jobs created | Percent of base year employment | Mean change in total employment from any source |
|---|---|---|---|---|
| Natural gas | 757 | 1,780 | 12 | 3,199 |
| Wind | 30 | 59 | 0.6 | 3,047 |
| Ethanol | 139 | 82 | 0.9 | 254 |
| Notes: The natural gas employment effects reflect the outcomes of 61 counties in Texas, Wyoming, and Colorado that experienced substantial increases in gas production in the study region and period. Similarly, the effects for wind reflect 128 counties with installed wind power capacity; for ethanol, the effects are for 46 counties that received a single ethanol plant. Source: USDA, Economic Research Service. |
||||
Another way to look at the impact of energy development on jobs is to compare the employment growth associated with development to overall employment growth. For counties with natural gas development and those with wind development, the total change in employment from any source over the study period was roughly 3,000 jobs per county. Counties with an ethanol plant saw smaller changes on average, at 254 jobs per county. Relative to the total change in employment over the period, the employment effect associated with natural gas development (1,780) was about half of the total change; for wind, it was roughly 2 percent. Because of the smaller total change in employment for ethanol counties, the employment effect of the typical ethanol plant, at 82 jobs, accounted for about a third of the total employment growth in the typical ethanol plant county.
How Were Employment Effects Estimated?
ERS economists used empirical approaches to estimate causal effects based on a model of what would have happened in a county if expansion of the energy industry in question had never occurred. This approach contrasts with most existing studies, which have used an input-output model approach to simulating employment and income impacts. When used appropriately, input-output and other simulation models can provide realistic projections of the economic activity supported by expansion of an industry. After expansion has occurred, empirical studies such as the ones of emerging energy industries can provide reliable estimates of the economic impact to local economies because they can observe actual changes in employment.
The empirical estimates consider all jobs created, including those created from spending in the local economy by industry-related employees and jobs in the industry or those linked to it (e.g., jobs in natural gas companies and jobs in companies that manufacture pipeline materials). The estimates also allow the expansion of the energy industry to cause other industries or sectors to contract.
The industry-specific studies employed a combination of statistical techniques, all with the same empirical thrust. They compare the growth in counties where the energy industry expanded with the growth in counties with less or no expansion, while controlling for other potential differences between counties. All of them considered changes in employment from the early 2000s through the mid-00s. In the case of natural gas, counties that experienced a large increase in natural gas production in Texas, Colorado, and Wyoming were compared with counties in the same States that did not experience such an increase or were adjacent to counties that did. The wind analysis directly estimated the relationship between changes in installed wind capacity and employment and income for counties in a 12-State region comprised of States in the Great Plains and Midwest that together accounted for most of the increase in wind capacity in the 2000s. The ethanol study considered a similar 12-State region and compared counties with an ethanol plant to similar counties without a plant.
The Three Emerging Industries: Their Growth, Opportunities, and Challenges
The scale of expansion of each industry varied, as did its causes. Each industry also has multiple consequences for local communities that are not captured by one indicator such as employment, which does not measure the net benefits provided locally or consider the distribution of costs and benefits among local residents.
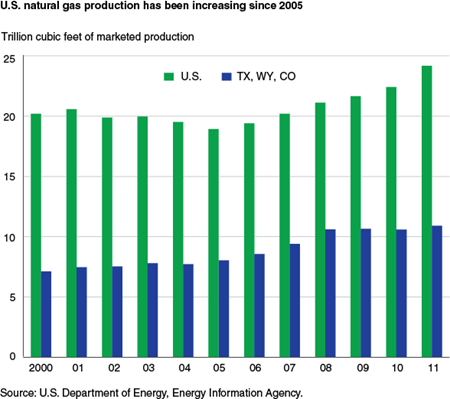
From 2000 to 2010, production of conventional gas declined by more than 4 trillion cubic feet. Production of unconventional gas, by contrast, increased by almost 7 trillion cubic feet, reversing the decline in overall gas production that occurred during the early 2000s. Production has expanded every year since 2005, increasing by 28 percent from 2005 to 2011. Reservoirs of unconventional gas are distributed throughout much of the United States, but most large-scale development first occurred in three of the leading producing States of onshore natural gas: Colorado, Texas, and Wyoming. From 2000 to 2008, the share of U.S. production accounted for by the three States rose from 35 to 50 percent. More recently, several other States have experienced dramatic increases in production, including Arkansas, Pennsylvania, and Louisiana.
The growth in production reflects changes in technology that made it easier to extract unconventional gas together with higher well-head gas prices. The two primary innovations in drilling technology are hydraulic fracturing and horizontal drilling. Hydraulic fracturing involves injecting a mix of chemicals and water deep into the ground to open fissures in rocks and has been used in some form for decades. Innovation in drilling horizontally has occurred more recently, partly because of the Federal Government’s investment in research on extracting gas from hard rock formations, which lowered the cost of drilling horizontal wells. Horizontal drilling allows gas to be drawn from larger areas, thereby reducing the pipelines and wells needed for extraction and gathering.
Developing unconventional natural gas has implications for the quality of life of rural residents that extend beyond local aggregate employment effects. The growth in production has caused natural gas prices to decline from roughly $8 per 1,000 cubic feet in 2008 to around $4 per 1,000 cubic feet. Lower prices have meant lower heating bills for households and lower costs for industries using natural gas. In addition, the industry has paid billions of dollars to owners of mineral rights and generated tax revenues at every level of government.
Nonetheless, the distribution of local costs and benefits can be uneven. The influx of gas company workers and contractors can cause housing costs to increase, straining the budgets of low-income residents not employed in the industry. Landowners without mineral rights may receive almost nothing from drilling pads on their property, while those owning mineral rights may receive lease and royalty payments that total hundreds of thousands or even millions of dollars. Drilling can also strain public infrastructure. One unconventional gas well can require thousands of truckloads of materials, causing roads to deteriorate, and up to 10 million gallons of water, much of which will return to the surface and require proper management in impoundments or wastewater treatment plants. The industry response to these strains has varied across communities.
The environmental consequences of unconventional natural gas drilling have drawn attention mostly to hydraulic fracturing, the method commonly used to extract unconventional gas. Although the likelihood of environmental or human health damages is hard to quantify, potential risks include the migration of natural gas or fracturing fluids through the subsurface or spills of wastewater on the surface. More broadly, methane venting or flaring, volatile organic compounds from wastewater, and diesel exhaust from heavy truck traffic can lower air quality.
Wind
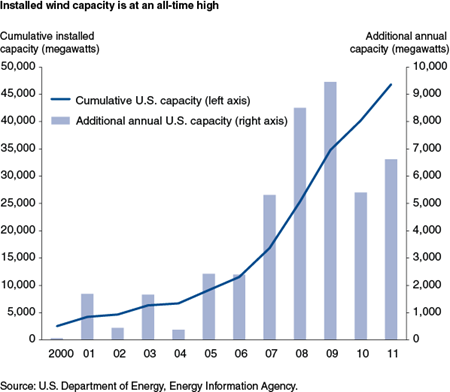
Wind power capacity has expanded substantially in the United States. From 2000 to 2011, the cumulative installed capacity increased from 2,500 to 46,800 megawatts, with most installations occurring in the Great Plains and Midwest where wind resources abound and there is ample land for wind turbines. Wind contributed 36 percent of all new electric generation capacity added to the U.S. power system from 2007 to 2010, and it is technically feasible for a fifth of the U.S. electric supply to come from wind power by 2030. But despite recent growth in the wind power industry, wind accounts for less than 3 percent of the electricity generated in the United States.
Higher electricity prices and supportive Federal and State government policies during the past decade have encouraged wind development. At the Federal level, the production-based tax credit established by the Energy Policy Act of 1992 reduces the income subject to taxes for qualified wind developers by 2.2 cents per kilowatt-hour of electricity produced for the first 10 years of operation. The more recent ability to convert the credits to an upfront cash grant helped the wind industry weather the 2008-10 financial crisis. State-specific renewable portfolio standards requiring electricity suppliers to use a certain amount of renewable energy in their supply mix have been another source of support for the emerging wind power industry.
Wind power uses much less water than corn-based ethanol production or unconventional natural gas extraction. Still, wind turbines can impose costs on nearby residents. Turbines can interrupt rural landscapes, harm birds, and create noise. The turning of turbine blades can cause a flickering of light when the blades come between the observer and the sun. During winter, ice can form on the blades and can be thrown a good distance.
Ethanol
Since the early 2000s, ethanol has increased in importance as a source of fuel in the United States, with production increasing from 1.6 billion gallons to 13.9 billion gallons in 2011. The increase came primarily from greater production of corn-based ethanol. By the end of 2011, there were 209 ethanol biorefineries in 29 States, using roughly 5 billion bushels of corn. Growth of the industry stems from high energy prices, State and Federal policies, and gains in economies of scale as the ethanol market has expanded. Most of the increase in production occurred in rural areas where supplies of corn and other feedstock are readily available and users of byproducts (e.g., dry distillers grain) like livestock producers are nearby.
Federal and State policies have supported increased demand for ethanol. The 2005 Energy Policy Act created the Renewable Fuel Standard, which was later revised and now mandates that 15 billion gallons of biofuels be used in gasoline annually by 2015. Other Federal policies supporting the industry include the Reformulated Gasoline Program, the Winter Oxygenated Fuels Program, the Small Ethanol Producer Tax Credit of 10 cents per gallon for plants producing less than or equal to 60 million gallons of ethanol per year, and the 45-cents-per-gallon ethanol blender’s credit. State policies also have supported the industry through producer incentives (grants or preferential tax treatment); retailer/infrastructure incentives for ethanol blends; State use mandates; retail pump label requirements; and State fleet fuel-use requirements.
Similar to natural gas and wind power development, ethanol production has potential environmental costs. One plant can use from 1.5 to 4 gallons of water for each gallon of ethanol, and many local governments require ethanol plants to purchase water rights from other users so that the plants have no net effect on water demand. Plants also discharge wastewater with brine from purifying water or from cleaning salts that accumulate in cooling towers and boilers. The cost of acquiring clean water and disposing of wastewater has encouraged innovation in plant water management, such as using municipal wastewater, supplying discharge water to farmers for crop irrigation, and developing zero-discharge technology.
Possible Future Job Growth Constraints
The estimated contribution of each emerging industry to local employment varies because of the nature of the regional economy where the new industry occurs, differences in the scale of the industry, the intensity of labor use, and the linkages to other sectors in the local economy. In looking only at employment, however, our analysis provides a limited view of how the industries affect life in rural communities. Each industry brings its own challenges for local communities: groundwater concerns with natural gas; disruption of the landscape by wind turbines; and wastewater or water usage from ethanol plants. The net economic benefits to an area may be quite different than what is suggested by the number of jobs created.
Emerging Energy Industries and Rural Growth, by Jason Brown, Jeremy G. Weber, and Tim Wojan, USDA, Economic Research Service, November 2013
“Ex Post Analysis of Economic Impacts from Wind Power Development in U.S. Counties”, Energy Economics 34(6):1743-1754, December 2012
“The Effects of a Natural Gas Boom on Employment and Income in Colorado, Texas, and Wyoming”, Energy Economics 34(5):1580-1588, December 2012