

Data Feature
Economics of the Food and Fiber System
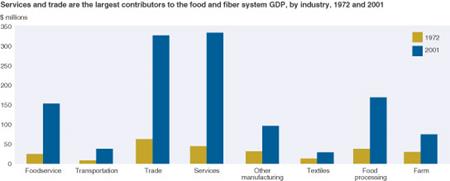
The U.S. food and fiber system (FFS) is a source of jobs and earnings for millions of American workers and a supplier of products worldwide. The food and fiber system encompasses a vast range from farm suppliers to fast food chains. The activities of farmers, processors, manufacturers, wholesalers, retailers, restaurateurs, and transporters are coordinated to satisfy the changing demands of households, businesses and government, and other nations. The total FFS economy added $1.24 trillion to the Nation’s gross domestic product (GDP), a measure of the Nation’s wealth, and provided jobs for 23.7 million workers in 2001. Of the $1.24 trillion, almost $339 billion came from services, while $334 billion came from trade, and $73.8 billion from the farm sector.
Food and fiber GDP and employment increased almost every year between 1972 and 2001. Because the rest of the economy grew at a relatively faster pace, however, the food and fiber share of national GDP and employment declined. The FFS share of total GDP was 12.3 percent in 2001, down one-third from 1972. Similarly, employment generated by the system has trended downward from 23.4 percent of total employment in 1972 to 16.7 percent in 2001.
Changes in consumer demand for products and services affect both size and contribution, in jobs and value, of industries within the food and fiber system. Consumers now demand more services in their total food and fiber consumption shopping cart, and food consumed away from home has increased. In 2001, households spent 46 percent of their total food dollar in restaurants, compared with 34 percent in 1972. According to ERS research, spending in grocery stores accounted for 53.8 percent of the food dollar in 2001, down from 66 percent in 1972.
The core materials sectors—farm, food processing, textiles, and other manufacturing—generated 41 percent of food and fiber GDP and employment in 1972, falling to 30 percent of GDP and 21 percent of jobs in 2001. Wholesale and retail trade and the foodservice sectors grew, providing 63 percent of all food and fiber system jobs in 2001. The trade and service sectors generated the most GDP in 2001, almost 55 percent of the FFS total. In 1972, the trade sector (wholesale and retail) contributed the most to GDP, followed by services, other manufacturing, food processing, and farming. In 2001, services tied trade as the largest industry, and foodservice has become the fourth largest in the food and fiber sector.
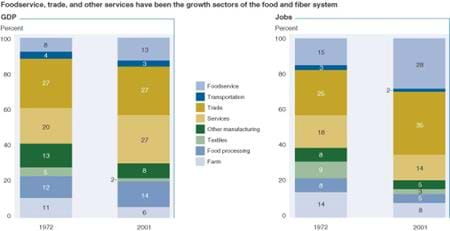
Farm employment has remained steady since 1972, while the textile industry has fallen from the fifth largest generator of jobs to the seventh out of eight FFS industry sectors. Foodservice and trade have been the growth sectors for food and fiber sector jobs. The share of foodservice jobs in the FFS sector increased from 15 percent in 1972 to 28 percent in 2001.
The various sectors of the food and fiber system affect the economy differently. In some sectors, such as food processing, the share contributed to GDP was more than twice the share of employment. In contrast, the relatively low-wage, labor-intensive foodservice sector job share was more than twice its GDP share in 2001.
Note
Every 5 years, the U.S. Department of Commerce publishes a new benchmark set of National Input-Output tables from which these estimates of economic activity in the food and fiber system are derived. This year, in addition to the benchmark, all industries have been redefined to match the new government-wide North American Industrial Classification System (NAICS), causing significant delays in the release of 2002 estimates of FFS GDP and employment. These FFS estimates are closely aligned with the methodology and accounting procedures of the U.S. Department of Commerce National Income and Product Accounts. Some fluctuations in the forthcoming annual estimates are expected because of this government-wide data overhaul.