

Trends in U.S. Per Capita Milk and Cheese Consumption, 1909 to 2001
Dairy products make important contributions to the American diet. They provide high-quality protein and are good sources of vitamins A, D, and B-12, and also riboflavin, phosphorus, magnesium, potassium, zinc, and calcium.
In 1909, Americans consumed a total of 34 gallons of fluid milk per person—27 gallons of whole milk and 7 gallons of milks lower in fat than whole milk, mostly buttermilk. Back then, buttermilk was the byproduct of churning milk or cream into butter, often done on farms. Today, the major byproduct of the commercial butter-making process is nonfat dry milk, and our buttermilk is cultured, or soured, by the addition of lactic acid or suitable bacteria to sweet milk. More than half (56 percent) of the milk consumed in 1909 was consumed on the farms where it was produced, compared with 10 percent in 1960 and 0.3 percent in 2001.
Significant improvements in milk production in the first half of the 20th century helped to control the spread of disease and enhance the nutritional value of milk. In the early 1900s, when diseases like typhoid fever and diptheria were spread through the milk supply, public health authorities promoted pasteurization and other measures to eliminate disease-producing organisms from milk. In the 1930s and 1940s, fortification of milk with vitamin D was a critical step in the control of rickets, a vitamin D deficiency disease of children in which bones are softened or deformed. Homogenization prevented milkfat (cream) and fat-soluble vitamin D from rising to the top of the milk and being poured off for uses other than drinking and ensured that children obtained the nutrients they needed from drinking milk.
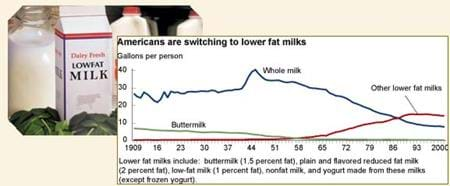
Fluid milk consumption shot up from 34 gallons per person in 1941 to a peak of 45 gallons per person in 1945. War production lifted Americans’ incomes but curbed civilian production and the goods consumers could buy. Many food items were rationed, including meats, butter, and sugar. Milk was not rationed, and consumption soared. Since 1945, however, milk consumption has fallen steadily, reaching a record low of just under 23 gallons per person in 2001 (the latest year for which data are available). Steep declines in consumption of whole milk and buttermilk far outpaced an increase in other lower fat milks. By 2001, Americans were consuming less than 8 gallons per person of whole milk, compared with nearly 41 gallons in 1945 and 25 gallons in 1970. In contrast, per capita consumption of total lower fat milks was 15 gallons in 2001, up from 4 gallons in 1945 and 6 gallons in 1970. These changes are consistent with increased public concern about cholesterol, saturated fat, and calories. However, the decline in per capita consumption of fluid milk also may be attributed to competition from other beverages, especially carbonated soft drinks and bottled water, a smaller percentage of children and adolescents in the U.S., and a more ethnically diverse population whose diet does not normally include milk.
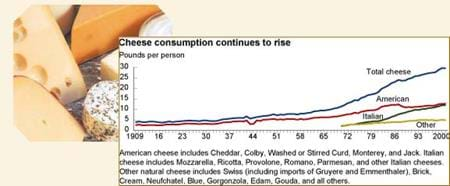
In 2001, Americans consumed 30 pounds of cheese per person, 8 times more than they did in 1909 and more than twice as much as they did in 1975. Demand for time-saving convenience foods is a major force behind this growth in cheese consumption. More than half (about 55 percent to 65 percent) of our cheese now comes in commercially manufactured and prepared foods (including for food service), such as fast food sandwiches and packaged snack foods. New products, such as resealable bags of shredded cheeses, have also raised consumption.
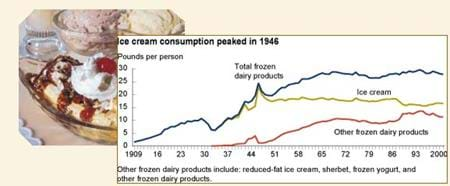
U.S. per capita consumption of ice cream reached an all-time high of 23 pounds (more than 20 quarts per person) in 1946 as America celebrated its World War II victory and sugar rationing was lifted. From 1949 through 1987, per capita ice cream consumption was relatively constant in the U.S. As more prepackaged ice cream was sold through supermarkets, traditional ice cream parlors and soda fountains started to disappear. Also during this period, average consumption of other frozen dairy products, such as sherbet and reduced-fat ice cream, increased. Since 1988, Americans, on average, have been eating a little less ice cream overall but more of the higher priced, higher milkfat premium and superpremium ice creams as well as frozen yogurt and other frozen dairy products.
Food Availability (Per Capita) Data System, by Linda Kantor and Andrzej Blazejczyk , USDA, Economic Research Service, April 2023