


Farm Business Income
Suggested citation for linking to this discussion:
U.S. Department of Agriculture, Economic Research Service. (2024, February 7). Farm Sector Income & Finances: Farm Business Income.
Average Net Cash Farm Income for U.S. Farm Businesses Forecast Down in 2024
Farm businesses are farms with annual gross cash farm income (GCFI)—annual income before expenses—of at least $350,000, or operations with less than $350,000 in annual gross cash farm income but that report farming as the operator's primary occupation. Farm businesses account for about half of all U.S. farms, but they contribute more than 90 percent of value of production and hold most of the sector’s assets and debt.
Average net cash farm income (NCFI) for farm businesses* is forecast at $72,000 for the calendar year 2024, down 27.2 percent from 2023 in nominal terms. Net cash farm income is cash receipts from farming as well as farm-related income, including Government payments, minus cash expenses. Lower NCFI could mean less cash available to pay debt, pay taxes, cover family living expenses, and invest. NCFI is not a comprehensive measure of profitability because it does not account for changes in noncash income, including adjustments in farm inventory, accounts payable, accounts receivable, the imputed rental value of operator dwellings, and capital consumption.
The average NCFI forecast for 2024 is down across all farming regions and commodity specializations** following expectations for lower cash receipts and Government payments plus higher expenses relative to 2023. In 2024, farm businesses specializing in cotton are forecast to see the largest dollar decrease and farm businesses specializing in wheat are forecast to see the largest percent decrease in average NCFI. Among the nine USDA, ERS resource regions (see the FAQ on ERS resource regions), farm businesses in the Northern Great Plains region are forecast to have the largest dollar and percent decrease in average NCFI. See data tables on farm business average net cash income below:
- Farm-level average net cash income by farm typology and sales class
- Farm business average net cash income by commodity specialization and region
Average Net Cash Farm Income for Farm Businesses Across All Commodity Specializations is Forecast to Decline
Farm businesses in all six crop commodity specializations are forecast to have a decrease in average NCFI in 2024. Farm businesses specializing in cotton are expected to see the largest dollar ($91,600) decrease with average NCFI forecast at $226,000 in 2024. Farm businesses specializing in wheat are expected to see the largest percent (50.4) decrease with average NCFI forecast at $71,600 in 2024.
| Farm specialization | Average NCFI, 2024F | Change in average NCFI, 2023F–2024F |
|---|---|---|
| Dollars (per farm) | Percent | |
| Cotton | 226,000 | –29 |
| Corn | 153,600 | –34 |
| Wheat | 71,600 | –50 |
| Soybeans | 70,100 | –40 |
| Specialty crops 1/ | 201,100 | –11 |
| Other crops | 62,400 | –27 |
| F = forecast. NCFI = net cash farm income. 1/ Specialty crops include fruit and tree nuts, vegetables, and nursery/greenhouse. Source: USDA, Economic Research Service, Farm Income and Wealth Statistics data product, Farm business average net cash income by commodity specialization and region. Data as of February 7, 2024. |
||
For all types of farm businesses specializing in animals/animal products, average NCFI is forecast to decrease in 2024 relative to 2023. For those specializing in dairy, average NCFI is forecast to see the largest dollar ($88,300) and percentage (42 percent) decrease compared with 2023 levels to $122,500 in 2024 partly due to lower expected Government payments in 2024.
| Farm specialization | Average NCFI, 2024F | Change in average NCFI, 2023F–2024F |
|---|---|---|
| Dollars (per farm) | Percent | |
| Dairy | 122,500 | –42 |
| Hogs | 175,100 | –25 |
| Poultry | 59,800 | –19 |
| Cattle/calves | 24,800 | –26 |
| F = forecast. NCFI = net cash farm income. Source: USDA, Economic Research Service, Farm Income and Wealth Statistics data product, Farm business average net cash income by commodity specialization and region. Data as of February 7, 2024. |
||
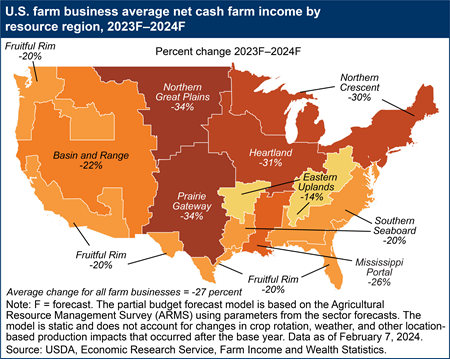
Average Net Cash Farm Income is Forecast To Decrease in All Regions
Regional performance of farm businesses can vary considerably because of the heavy geographic concentration of certain production specialties. In all nine USDA, ERS Farm Resource Regions are expected to see a decrease in average net cash farm income in 2024 compared with 2023. Farm businesses in the Northern Great Plains region are forecast to see the largest dollar ($56,300) and percentage (33.8) decrease in average NCFI per farm following lower cash receipts and lower Government payments.
*Farm businesses are defined as operations with gross cash farm income of more than $350,000 (labeled "commercial") or smaller operations where farming is reported as the operator's primary occupation (labeled "intermediate"). USDA Agricultural Resource Management Survey data for 2022 indicate that 11.9 percent of U.S. farms are commercial, and 36.1 percent are intermediate. Residence farms make up the remaining 52.0 percent of operations; these are small farms with operators whose primary occupation is something other than farming.
**Commodity specialization is determined by a farm business having at least 50 percent of the value of production from a particular commodity. Farm businesses often produce multiple commodities, so average net cash farm income statistics should not be interpreted as resulting solely from the production and sale of the commodity highlighted as the specialization.