

Summary Findings
Productivity Has Replaced Resource Intensification as the Primary Source of Growth in World Agriculture
Since the 1960s, global agricultural output has increased at an average annual rate of between 2 and 3 percent (in volume terms, holding prices constant). The figure below decomposes global agricultural growth (measured by the height of the bars, in average annual percent growth) into growth due to expanding the use of resources and to raising total factor productivity (TFP). The figure shows that output growth was high in the 1960s, slowed in the 1970s and 1980s, accelerated in the 1990s and 2000s, but slowed again in the most recent period shown in the chart (2011–21). In this latest period (2011–21), global output of total crop, animal, and aquaculture commodities grew by an average rate of 1.94 percent per year.
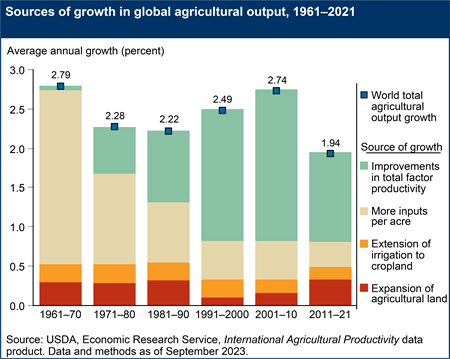
The different colors of the bars show how much of total output growth came from bringing new resources into production, including expansion of agricultural land, extension of irrigation to existing cropland (a form of land augmentation), and the intensification of input use (more labor, capital, and material inputs per acre), and how much came about by raising the TFP of these resources.
In the decades prior to 1990, most output growth came about from intensifying input use. Bringing new land into agriculture production and extending irrigation to existing agricultural land were also important sources of growth. Since the 1990s, growth in TFP rather than factor accumulation (growth in land, irrigation, and other inputs) accounted for most of the growth in world agriculture output. In the most recent period (2011–21), TFP grew an annual rate of 1.14 percent, accounting for 59 percent of the growth in agricultural output.
Productivity Varies Across Countries
Not captured by these global averages is a large variation in the rate of agricultural productivity growth across countries. The map below shows annual average agricultural TFP growth by country since 1971. Agricultural TFP grew most rapidly (at 2 percent or more per year on average) in the darkest-colored countries and more slowly in the lighter-colored countries.
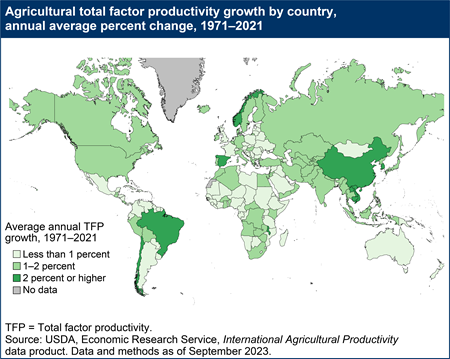
National policies and institutions—especially those that promote innovation and technical change—play a major role in driving TFP growth in agriculture. Strengthening the capacity of national agricultural research and extension systems to develop and deliver new agricultural technologies to farmers has been key to raising agricultural productivity (Fuglie, 2018; Evenson and Fuglie, 2010). Long-term investments in agricultural research were especially important to sustaining higher agricultural TFP growth rates in large, rapidly developing countries such as Brazil (Rada and Valdes, 2012) and India (Rada and Schimmelpfennig, 2015). Chinese agriculture benefited enormously from institutional and economic reforms as well as technological changes resulting from investments in research (Fan, 1991; Lin, 1992; Jin et al., 2002). Russian agriculture underwent a significant contraction in the 1990s when it made a transition from a planned to a market economy. It rebounded after 2000, and the southern region of the country achieved substantial productivity improvement while other regions have continued to lag (Rada et al., 2017). Under-investment in agricultural research and extension as well as poor market infrastructure remain important barriers to stimulating agricultural productivity growth in Sub-Saharan Africa (Fuglie and Rada, 2013).
Productivity and Agricultural Output Growth Vary Across Country Income Groups
Another view of agricultural output and productivity performance is given in the figure below, which shows trends in agricultural output and input use from 1961 to 2021 for countries grouped by their 2023 per capita income level (as classified by the World Bank). The indices show the growth in total agricultural outputs and total input use relative to 1961 levels. The difference between the output and input indices in the figure is the effect of TFP growth on output: without change in TFP, output growth would track input growth. In high income countries, agricultural output has grown relatively slowly (roughly doubling from 1961 to 2021) while total input use since the 1980s has declined. The slow rate of growth in agricultural output in high income countries partly reflects the slow rate of growth in food demand due to slowing population growth and a low income elasticity of food demand in these countries. Agricultural output has grown most rapidly in middle income countries, where productivity began to take off in the 1990s. Output has also grown fairly rapidly in low income countries (many of which are in Sub-Saharan Africa), but growth here has relied heavily on bringing more inputs into production rather than on raising productivity. Growth in demand for agricultural commodities is much higher in middle and low income countries compared with high income countries. This is due not only to higher population growth in these countries but also a higher income elasticity of food demand as households in these countries diversify their diets to include more nutrient rich foods like animal products as their incomes rise.