

Documentation
A food dollar represents a $1 expenditure on domestically produced food by U.S. consumers. The food dollar is allocated to expenditures on each of the various food commodities sold in proportions that represent their share of annual sales in the U.S. market. See the Food Prices, Expenditures, and Establishments page for information on total U.S. food expenditures and U.S. Agricultural Trade for information on the import share of domestic food expenditures.
The Food Dollar Series divides the food dollar into a set of input-component values. There are three primary series—the marketing bill series, the industry group series, and the primary factor series. For each primary Food Dollar Series, the combined input-component values are equal to the $1 output-market value. The three series represent distinct perspectives on the sources of market value for the combined annual food dollar expenditures.
This page provides information on:
- Marketing bill series
- Industry group series
- Primary factor series
- Underlying detailed value-added data
- Data sources and estimation methodology
- Recommended citation
Marketing bill series
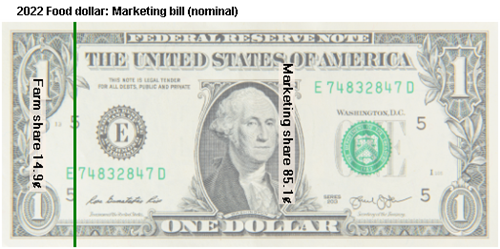
The marketing bill series is based on sales proceeds. Proceeds from each food dollar expenditure are divided into two subcomponents of market value:
- The farm share measures proceeds of farm commodity sales tied to a food dollar expenditure and sold to nonfarm establishments. The farm share does not include sales of farm commodities that are incorporated into other commodities and resold to a domestic farm industry to avoid double counting.
- The marketing share is the market value added to farm commodities embodied in a food dollar expenditure, measured as $1 minus the farm share.
For calendar year 2022, the farm share was 14.9 cents of each food dollar expenditure and the marketing share was 85.1 cents, accounting for the remainder of the food dollar.
Value-Added Component Series: For establishments contributing to the U.S. food supply, value added for an establishment equals the proceeds from the sale of outputs minus the outlays for commodities purchased from other establishments. The sum of value added by all establishments that contribute to total food dollar purchases equals $1. The industry group and primary factor series are based on this value-added concept.
Industry group series
Industry groups are establishments grouped together by type of product or service provided. Twelve industry groupings are examined based on the importance of their contributions to the market value of food. For subcontracting establishments (i.e., those not classified into one of the 12 industry groups) their value-added contributions are allocated across the 12 industry groups in proportion to the value of goods or services provided to each industry group. The 12 industry groups are:
- Agribusiness—all establishments producing farm inputs (except those described in other industry groups) such as seed, fertilizers, farm machinery, farm services, and all subcontracting establishments.
- Farm production—all establishments classified within the agriculture, forestry, fishing, and hunting industries.
- Food processing—all establishments classified within the food and beverage manufacturing industries and all subcontracting establishments.
- Packaging—all establishments classified within the packaging, container, and print manufacturing industries, and all subcontracting establishments.
- Transportation—all establishments classified within the freight services industries and all subcontracting establishments.
- Wholesale trade—all nonretail establishments reselling products to other establishments for the purpose of contributing to the U.S. food supply and all subcontracting establishments.
- Retail trade—all food retailing and related establishments and all subcontracting establishments.
- Food service—all eating, drinking, and related establishments as well as all subcontracting establishments.
- Energy—oil and coal mining, gas and electric utilities, refineries, related establishments, and all subcontracting establishments.
- Finance and insurance—all financial services and insurance carrier establishments and all subcontracting establishments.
- Advertising—all advertising services and related establishments and all subcontracting establishments.
- Legal and accounting—establishments providing legal, accounting, and bookkeeping services, as well as all subcontracting establishments.
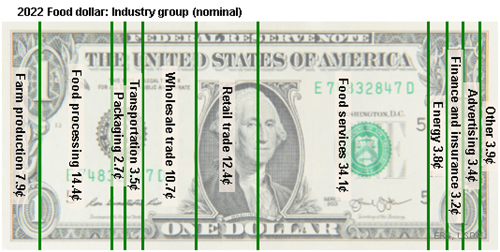
For calendar year 2022, farm production value added was 7.9 cents of each food dollar expenditure, implying that 7.0 cents from farm commodity sales (from the 14.9-cent farm share) was used to purchase products from the other industry groups. The 2022 industry group, value added food dollar also indicates about 46.5 cents of the food dollar value cover the services from food retailers (12.4 cents) and foodservice establishments (34.1 cents). Energy used throughout the food supply chain accounted for 3.8 cents of every 2022 food dollar expenditure. Advertising accounted for 3.4 cents of a food dollar expenditure.
Primary factor series
Primary factors are assets employed by establishments to use or transform products purchased from other establishments (intermediate inputs) to produce and market a different product. These assets add market value to the purchased intermediate products. In the food dollar accounts, value added is recorded as income to primary factors as follows:
- Domestic hired labor is allocated salary and benefits for services on behalf of a domestic establishment that directs sales towards fulfilling the supply of food to the U.S. market.
- Property income—machinery, equipment, structures, natural resources, product inventory, and other tangible or intangible assets are allocated compensation to various owners for services on behalf of a domestic establishment that direct sales to the U.S. food supply.
- Output taxes—excise, sales, property, and severance taxes (less subsidies), customs duties, and nontax fees are levied by Federal, State, and local governments independently of establishment dispersals to primary factor owners. Taxes tied to outlays for domestic labor and capital (such as income-based taxes) are not reported separately but are included in the primary domestic factor returns.
- Imports—international assets are compensated for their services on behalf of nondomestic establishments whose products are imported and are directed to supplying U.S.-produced food to the U.S. market. Because these services cannot be traced to their primary factor sources, their values are measured in the form of the products imported, and their value added is assigned to industry groups with which they are associated.
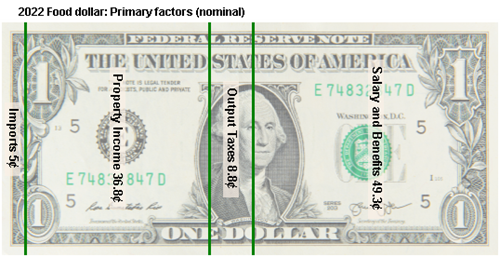
For calendar year 2022, the primary factor series indicates 49.3 cents of every food dollar expenditure go to the salary and benefits of domestic workers, 36.8 cents is dispensed as property income, and the remainder is split between U.S. Government (output taxes) and international assets (imports).
Underlying detailed value-added data
Cross-tabulated statistics of primary factor value added data by industry groups are displayed in table form because these data provide more detail than can effectively be displayed in a food dollar visual. The underlying detailed value-added data for 2022 are presented below:
| Industry group |
Total (cents) |
Imports (cents) |
Output taxes (cents) |
Property income (cents) |
Salary and benefits (cents) |
|||
|---|---|---|---|---|---|---|---|---|
| All industries | 100.0 | 5.0 | 8.8 | 36.8 | 49.3 | |||
| Agribusiness | 2.1 | 0.6 | 0.1 | 1.0 | 0.4 | |||
| Farm production | 7.9 | 1.0 | 0.0 | 5.4 | 1.5 | |||
| Food processing | 14.4 | 1.1 | 0.6 | 5.1 | 7.6 | |||
| Packaging | 2.7 | 0.9 | 0.1 | 0.7 | 1.0 | |||
| Transportation | 3.5 | 0.0 | 0.1 | 1.5 | 1.9 | |||
| Wholesale trade | 10.7 | –0.3 | 1.8 | 4.2 | 5.1 | |||
| Retail trade | 12.4 | 0.3 | 2.0 | 3.5 | 6.6 | |||
| Food services | 34.1 | 0.5 | 3.6 | 9.7 | 20.3 | |||
| Energy | 3.8 | 0.5 | 0.3 | 2.0 | 1.0 | |||
| Finance and insurance | 3.2 | 0.1 | 0.1 | 1.3 | 1.6 | |||
| Advertising | 3.4 | 0.2 | 0.1 | 1.7 | 1.4 | |||
| Legal and accounting | 1.8 | 0.1 | 0.1 | 0.6 | 1.1 | |||
| Note: Values may not add to totals due to rounding. Source: USDA, Economic Research Service, Food Dollar Series, 2023. |
||||||||
Food dollar data tables are available in Excel and csv formats; for more information, see Download the Data.
Data sources and estimation methodology
USDA, Economic Research Service’s (ERS) national input-output Food Dollar Series is based on three data sources:
- Annual input-output (IO) data published every year by the U.S. Department of Labor, Bureau of Labor Statistics (BLS);
- Data from the 1997, 2002, 2007, and 2012 detailed U.S. benchmark IO accounts published by the U.S. Department of Commerce, Bureau of Economic Analysis (BEA); and
- IO data published annually as part of the U.S. Department of Commerce, BEA’s Industry Economic Accounts.
Using conventional IO analysis, the annual marketing bill series is estimated for all available years from 1993 to 2022. The current data for 2013–2022 are preliminary and subject to revision when the next detailed U.S. benchmark IO accounts are released. The real (inflation-adjusted) 2022 data are also available.
Supply chain IO analysis is used to determine where food dollars end up (as income) by tracing the market value added measures for 12 supply chain industry groups (Industry group Food Dollar Series) and for primary production factors (Primary factor Food Dollar Series). All estimates are reported in both nominal (current price) and real (inflation-adjusted) dollars.
With data for the 1997, 2002, 2007, and 2012 detailed U.S. benchmark IO accounts forming the basis for USDA, ERS's Food Dollar Series, U.S. Department of Labor’s BLS IO data are used to index all 1997 Food Dollar Series for annual estimates for 1993–1996. U.S. Department of Labor’s BLS IO data are used to index all 2012 Food Dollar Series forward to annual estimates for the years 2013 to the present. The same U.S. Department of Labor, BLS IO data are used to produce a chain-weighted index for each Food Dollar Series for the years between benchmark estimates (1998–2011). For more detail on these data sources and estimation methods, see the 2011 report:
A Revised and Expanded Food Dollar Series: A Better Understanding of Our Food CostsFor this release, there were notable changes to the source data for the Food Dollar Series. The U.S. Department of Commerce, BEA published a comprehensive update to their National Economic Accounts, which included revised source data and changes in methodologies. Additionally, the U.S. Department of Labor, BLS IO data revised its system of accounts to match the 2022 North American Industry Classification Systems (NAICS), which resulted in industry group compositions changes.
Before 2021, to update the U.S. Department of Labor, BLS’ annual IO data released in even-numbered years, or the base year account, to an interim year account reported in odd-numbered years, USDA, ERS used a mathematical programming model to reconcile the more detailed base year account with the less detailed interim year account. The mechanics of this process are the same as is described in USDA, ERS’ report A Revised and Expanded Food Dollar Series: A Better Understanding of Our Food Costs (see page 39, equations A22 to A24), with the added dimension of bringing the accounts forward 1 year. Starting with the 2021 updates, U.S. Department of Labor, BLS IO data are released annually so the interim year updates are unnecessary.
These additional articles provide useful information about USDA, ERS's estimation methodology:
- Follow the Food Dollars (2017);
- Canning, P., Weersink, A., & Kelly, J. (2016). Farm share of the food dollar: An IO approach for the United States and Canada. Agricultural Economics 47, 505–512;
- Kelly, J., Canning, P., & Weersink, A. (2015). Decomposing the farmer’s share of the food dollar. Applied Economic Perspectives and Policy 37(2), 311–31;
- ERS Food Dollar Series Allows an Indepth Look at Farm Level Components of the U.S. Food Dollar (2013); and
- A New Look at Where Our Food Dollars Go (2011).
Recommended citation
U.S. Department of Agriculture, Economic Research Service. (2023, November). Food Dollar Series.