

Documentation for the Farm Sector Balance Sheet
The balance sheet of the agricultural sector provides estimates of the value of the physical and financial assets in the U.S. agriculture sector over time. USDA originally compiled the balance sheet to measure the effect of World War II and postwar adjustments on the financial position of farmers. Since first constructed in 1944, the annual balance sheet has been used to measure and compare changes in the agriculture sector’s capital and financial position over time. Balance sheet analyses help guide credit use for expanding or changing farming enterprises. The balance sheet is also useful in estimating the volume, value, and kinds of physical and financial resources that are available for agricultural production or that could be released for nonfarm purposes.
This documentation covers the information contained in the farm sector balance sheet, as well the estimation methodologies and data sources used in generating the individual balance sheet components. The balance sheet of the agricultural sector provides a snapshot of the sector's assets, debts, and equity as of December 31 or as close to the end of the year that the source data will allow. The balance sheet is designed to account for only the set of farm assets and liabilities used in the production of agricultural products. This set includes farm real estate assets leased from non-operator landlords and the liabilities outstanding on these assets. It also includes automobiles, trucks and farm machinery leased to farm operators.
Because of data and other limitations, ERS has not developed a sector-level balance sheet of agriculture that includes household assets and debts since 1992. The complexity of trying to allocate farm household financial accounts between farm and nonfarm activities was a key reason behind the change to a methodology excluding farm household assets and debts. It was further recognized that taking into account only the households of primary operators excluded many farm-dependent households, particularly for the largest, most complex farms. Over the last two decades, the financial and organizational structure of farms has become even more complex, with an increasing presence of multiple operators and household participants in farm ownership and governance. Therefore, the balance sheet treats farm operator households and businesses as separate entities, excluding the personal portion of farm households’ assets and debts from balance sheet estimates.
The documentation is broken down into two primary sections covering the data sources and methodology for farm sector assets and debts. Within each primary section, there is a general description followed by detailed information on the data sources and specific methodology used to construct the estimate of the respective asset or debt sub-components.
Farm Sector Assets
The balance sheet of the farm sector includes both physical assets (real and nonreal estate) and current assets. Physical assets are durable physical properties used in operations that have a useful life longer than one year. Examples include: land and buildings, which are captured as real estate assets, and machinery and equipment. Current assets are assets that may be converted into cash, sold or consumed within a year or less. This would include inventory, prepaid expenses, and financial assets such as cash, investments, and accounts receivable. The data sources and procedures used to estimate farm sector assets follow.
Real Estate Assets
The market value of real estate assets reported in the balance sheet includes farmland, buildings and other service structures. Adjustments are made to either include or exclude the value of operator dwellings. In order to estimate real estate assets, information on the quantity and value of farm land is needed. Estimates of both land in farms and the value of real estate per acre are provided by the National Agricultural Statistics Service (NASS).
Land in farms consists of agricultural land used for crops, pasture, or grazing. Also included is woodland and wasteland not actually under cultivation or used for pasture or grazing, provided it was part of the farm operator’s total operation. Land in farms includes acres in the Conservation Reserve, Wetlands Reserve Programs, or other government programs. Land in farms includes land owned and operated as well as land rented from others. Land used rent-free is included as land rented from others. All grazing land, except land used under government permits on a per-head basis, is included as land in farms provided it was part of a farm or ranch. Land under the exclusive use of a grazing association is reported by the grazing association and included as land in farms. All land in Native American reservations used for growing crops or grazing livestock is included as land in farms. Land in reservations not reported by individual Native or non-Native Americans is reported in the name of the cooperative group that used the land. In many instances, the entire American Indian reservation is reported as one farm.
The Census of Agriculture, conducted every five years, provides a base of the amount of land in farms. Annual data on land in farms are collected by the National Agricultural Statistics Service (NASS) during the June Agricultural Survey using sampling procedures to ensure every farm and ranch has a chance of being selected. In between Censuses, the June Agricultural Survey data used to measure the change in land in farms from the Census of Agriculture base. At the end of the five year cycle between Censuses, the annual estimates are revised backwards based on inter-census trends.
The estimates of land values reported by NASS are based primarily on the June Area Survey, which is conducted during the first two weeks of June. The estimate of real estate value represents the value at which all land and buildings used for agriculture production, including dwellings, could be sold if allowed to remain on the market for a reasonable amount of time under current market conditions. Data is reported by NASS as the average dollar value of real estate per acre.
Figure 1. Comparison of alternative land and building value date assumptions.
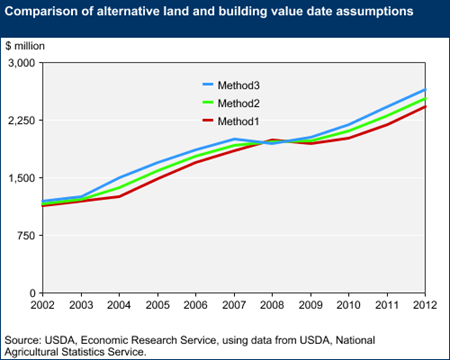
It is necessary to reconcile the Balance Sheet’s December 31st reference date with the June data gathering period of the NASS estimates of land. Three alternative assumptions can be made regarding the date reference for the market value of land and buildings reported by NASS. The value reported in August representing June survey results could be interpreted at the year-end value (Method 1). Conversely, the value reported could be interpreted as the year-end value for the previous calendar year, essentially lagging value by one year (Method 3). Our approach (Method 2) interpolates between two consecutive years June value to approximate the value on December 31. Figure 1 illustrates the trends in land value estimates resulting from the different assumptions. With the exception of change points, such as occurred during 2007-08, our approach represents the middle range of the alternative assumptions.
The final step in calculating the value of real estate assets for the balance sheet is to combine the land in farms and land value estimates according to the formula outlined below in equation 1.
Equation 1

Because the NASS statistics include land in farms and land value attributable to farm household dwellings, it is necessary to adjust the initial real estate value estimate to match the balance sheet’s methodology of excluding farm household’s assets and liabilities. The adjustment for the portion of total real estate value represented by dwellings is based on information summarized from the Agricultural Resource Management Survey (ARMS). The ARMS, collects information on the market value of assets owned by farm operators plus an estimate of the market value of land and buildings rented to and from others. Information for 2007-11 are summarized in Table 1: Calculation of dwelling share of farm real estate value, by year, 2002-2011. This information allows the total value of all land and buildings (row E) and value of farm household dwellings (row H) to be calculated. In turn, the ratio of farm household dwelling value to total land and building value can be computed according to the formula outlined in equation 2. Calculated values of the dwelling share ranged between 10-11 percent during this period.
Equation 2

The NASS land in farms and value of real estate are representative of all 50 states. On the other hand, ARMS only provides coverage for the 48 contiguous states and statistically reliable estimates of dwelling value for 15 core states. Therefore, using the percentage share of total assets from ARMS rather than a specific estimate of the value of dwellings enables the adjustment to be applied consistently across all 50 states.
Farm Machinery, Equipment, and Vehicles
The most comprehensive source of information on the value of machinery, equipment, and vehicles used in production agriculture is the Census of Agriculture. Figure 2, show the specific question asked in the 2007 Census of Agriculture. Note that the estimated value includes all machinery, equipment, and implements regardless of ownership.
Figure 2. Census of Agriculture question on the value of all machinery, equipment, and implements.
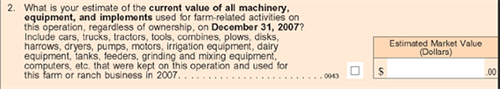
In non-census years, information collected in the ARMS is used to estimate the annual change in the market value of machinery, equipment, and vehicles. However, the Census asks for the market value of all machinery, equipment, and implements regardless of ownership, while ARMS collects data only on owned machinery, equipment and vehicles. Furthermore, The Census covers all 50 states compared to just the 48 contiguous states in ARMS. For this reason, the ratio of the Census value to ARMS value in overlapping years is used to adjust the ARMS value in subsequent years according to equation 3. The resulting value of farm machinery, equipment, and vehicles from 2002-2012 is shown in Table 2: Derivation of value of farm machinery estimate from ARMS and Census.
Equation 3

Commodity Inventory
The market values of livestock and crop inventories on December 31 are estimated by moving the previous year’s value by the estimate of the value of the change in inventory from the farm sector value-added accounts. The concept employed in the accounts for crop commodities is to measure the amount of commodities stored on farms by adding the physical change in crop inventory to last year’s estimate (equation 4) and value it using an annual season average price (equation 5). The value of inventory change for livestock is determined by taking the difference between the season average values per animal at the end of the previous year and end of the current year times the difference in the year-end number of head in inventory (equation 6). The value of livestock and poultry inventory change is then added to the previous year estimate of livestock and poultry value (equation 7).
Equation 4

Equation 5

Equation 6
![]()
Equation 7

Purchased Inputs
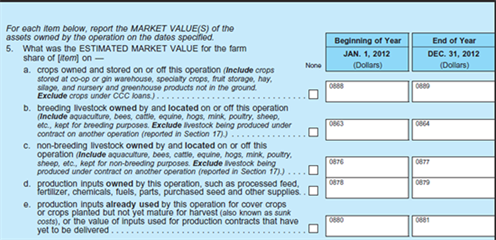
Purchased inputs represent the value of all prepaid expenses on supplies such as fertilizer and lime applied, seed, feed and other inputs purchases for next year’s production. It also includes the seed, fertilizer, fuel, and other expenses already invested in crops. ARMS data are used to construct the estimate for the farm sector. Figure 3 shows the specific question asked in the 2012 ARMS to determine the value of purchased inputs. The values reported for sections ‘d’ and ‘e’ correspond to the balance sheet definition of purchased input assets.
Figure 3. ARMS questions on the value of production inputs.
ARMS estimates of the amount of production inputs on hand and the amount already invested in growing crops on December 31 are summarized in Table 3: ARMS estimate of the value of production inputs. Both the value of production input supplies and growing crops have nearly doubled since 2002. The relative standard error for production input supplies ranged from a low of 3.4 percent in 2008 to a high of 11.6 percent in 2002. Growing crops had the best reliability as measured by the relative standard error in 2005 and the worst, also in 2002.
Because the ARMS data only cover the contiguous 48 states, an adjustment to the ARMS production input asset estimates must be made to include the value of production input assets in Alaska and Hawaii. The amount of purchased inputs for these states is estimated by multiplying the ratio of the year-end value of purchased inputs to cash expenses by total operating expenses in Alaska and Hawaii (equation 8). Since 2002, the ratio of purchased inputs to cash expenses as estimated from the ARMS has ranged between 5 and 7 percent, but has been growing over time. The calculation of the value of year-end purchased inputs for Alaska and Hawaii using this ratio is provided in Table 4: Estimating purchased input value for Alaska and Hawaii.
Equation 8

Financial Assets
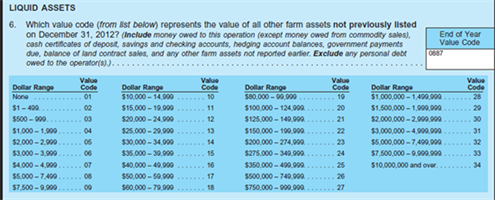
Financial assets include cash, and those assets that can be converted to cash in a reasonably short period of time, usually one year at most. See Table 5: ARMS estimates of the value of financial assets, 2003-2011. Cash includes cash money including paper and coins, checks and money orders to be deposited, money deposited in bank accounts that can be accessed quickly. Cash equivalents are highly liquid short term investments that can be turned into cash very quickly. These include U.S. Treasury bills, money market accounts, other short-term investments, and accounts receivable. The ARMS collects this category as a value code from respondents, where the value code is subsequently converted to the dollar amount of the range midpoint (figure 4).
Figure 4. ARMS question on the value of financial assets
The only measurement of financial assets for Alaska and Hawaii occurred in the 1999 Census follow-on survey Agriculture Economics and Land Ownership Survey (AELOS). The AELOS components of financial assets (stock in Farm Credit System, stock in farm cooperatives, and other assets) are reported in the Census of Agriculture table 30. The ratio of current year to previous year ARMS estimates of financial assets is used to move these values according to equation 9. The resulting estimates of financial assets for Alaska and Hawaii from 1999-2011 are shown in Table 6: Estimation of financial assets for Alaska and Hawaii. The final estimate of farm sector financial assets is reached by adding the financial asset estimates for Alaska and Hawaii to the ARMS estimates for the contiguous 48 states (equation 10).
Equation 9

Equation 10

Farm Sector Debt
The farm sector balance sheet reflects outstanding agricultural sector debt where it is held rather than where it originated. The sector-level estimates of debt are developed as composite measures that use data from multiple sources. Lender types included in the sector-level estimate of debt include the Farm Credit System, commercial banks, the Federal Agricultural Mortgage Corporation (FARMER MAC), the Farm Service Agency, life insurance companies and a group labeled individuals and others, which includes family members, input suppliers and equipment dealers, and other lenders.
The Farm Credit System and large commercial banks tend to serve larger, more financially secure commercial farmers. Other banks have tended to serve smaller farmers, while the Farm Service Agency serves average to below-average size farmers who cannot obtain credit at reasonable terms and rates from the institutional lenders. Historically, life insurance companies have also used agricultural real estate mortgages as part of their investment portfolio, leading the industry to originate and hold a significant amount of farm loans. FARMER MAC operates as a federally sponsored enterprise providing a secondary market for agricultural real estate mortgage loans, rural housing mortgage loans, and rural utility cooperative loans. In this capacity, FARMER MAC is an important holder of agricultural sector debt. Data for each of these lender categories is gathered from administrative sources. The “individuals and others” component of sector level debt reflects debt directly held by family members, input suppliers and equipment dealers, and other lenders.
Data for institutional lenders, such as banks, the Farm Credit System, FARMER MAC, and life insurance companies, are gathered via public sources or are made available by the applicable regulatory agency or lender association. Data from the Farm Service Agency are obtained from administrative sources. Debt held by the “individuals and others” lender category is estimated using data from the Agricultural Resource Management Survey (ARMS). More specific information on the data source for each lender type is discussed in more detail in the sections to follow.
Sector-level estimates of farm debt report aggregate data by lender type and therefore does not identify who owes the debt. At the sector level, agriculture is viewed as "one large farm." The borrower could be a farm business owner; an owner of assets--such as farmland, machinery, or livestock--leased by a farmer; or a nonfarm individual or firm involved in farm production, such as the production of livestock or crops under contract. Contractors, who tend to be large processing firms that are not considered part of production agriculture, may, for example, use debt financing to acquire young animals, buy feed, or purchase trucks for use in transporting animals or feed. Likewise, landowners may finance land purchases or, in their capacity as landlords, buy inputs for use in farm production. Lenders report these types of debt as farm debt based on their connection to farm production and assets.
Current Debt
Current debt is the value of liabilities owed to lenders within the next 12 months. This includes short-term production loans with a total term of 12 months or less as well as the current portion of longer term real estate and nonreal estate loan balances.
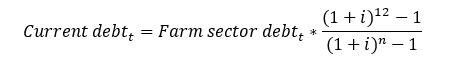
It would be preferable to calculate current debt for the farm sector by summing up the current liability portion of individual loans. However, that is not feasible due to data restrictions. Administrative data on outstanding loan balance data are only available at the farm sector level. Therefore, average interest rates and average loan terms information are needed at the sector level to calculate the current portion of total outstanding debt. As such, we calculate total farm sector debt as aggregate outstanding liabilities with an interest rate (i) calculated as the average interest rate from all outstanding loans listed in ARMS. The loan term remaining (n) is calculated as the average periods remaining to repay all loans from ARMS. The average for the interest rate and loan term remaining is weighted by loan balance. Payments are assumed to be made at the end of the month. Current debt for year t can then be calculated as the sum of principal payments expected to be paid within 12 months of year t.
Equation 11
Farm Sector Debt Administrative Data Sources
For many regulated lenders, the systems by which loan data and status are reported and stored are governed by supervisory reporting requirements. For example, this would include the Reports of Condition and Income (Call Report) data for individual commercial banks and savings bank institutions. Similarly, Farm Credit System (FCS) institutions are required by regulation to periodically submit data about their operations to FCA. The FCS data are primarily financial data that are submitted quarterly in the form of Uniform Call Reports (UCR). In using such administrative data sources, the main principal for the reporting of debt associated with production agriculture is to account for balances where the debt is held. Because the Farm Service Agency, insurance companies and Farmer Mac are not required by regulation to report financial data on agricultural lending via Call Reports, other sources of administrative data are utilized to gather the agricultural debt held by these entities. The specific administrative data source for each category of agricultural lender is discussed in detail in the sections to follow.
Farm Credit System
The Farm Credit System (FCS) is a nationwide network of borrower-owned lending institutions and specialized service organizations. Congress established the System in 1916 to provide a reliable source of credit for the nation's farmers and ranchers. The FCS provides credit and other services to agricultural producers and farmer-owned agricultural and aquatic cooperatives. It also makes loans for agricultural processing and marketing activities, rural housing, farm-related businesses, rural utilities, and foreign and domestic companies involved in international agricultural trade.
Farm Credit System institutions are required by regulation to periodically submit data about their operations to the Farm Credit Administration (FCA). The requirement results in the submission of primary financial data in the form of Uniform Call Reports (UCR). Other data are submitted annually and pertain to Farm Credit institutions lending activities to young, beginning, and small farmers and ranchers for the past year. These data are available in a variety of reports. A majority of the reports are the individual UCR schedules that Farm Credit institutions submitted for a specified quarter. In addition, FCA has developed several reports that provide data trends or comparisons.
The Summary by Lending Type Reports is used as source information for inclusion in the farm sector balance sheet. These reports aggregate the data from all institutions of the same lending type in the Farm Credit System. Specifically, we gather summary information for types of FCA institutions:
Agricultural Credit Association (ACA) An ACA is the result of the merger of a Federal Land Bank Association or a Federal Land Credit Association and a Production Credit Association and has the combined authority of the two institutions. An ACA obtains funds from a Farm Credit Bank or an Agricultural Credit Bank to provide short-, intermediate-, and long-term credit to farmers, ranchers, producers and harvesters of aquatic products, and to rural residents for housing. An ACA also makes loans to these borrowers for basic processing and marketing activities, and to farm-related businesses.
Agricultural Credit Bank (ACB) An ACB is the result of the merger of a Farm Credit Bank and a Bank for Cooperatives and has the combined authorities of those two institutions. An ACB provide services and funds to local Associations that, in turn, lend those funds to farmers, ranchers, producers and harvesters of aquatic products, rural residents for housing, and farm-related businesses. An ACB also provides lending and other financial services to farmer-owned cooperatives, rural utilities (electric and telephone), and rural sewer and water systems. In addition, an ACB is authorized to finance U.S. agricultural exports and provide international banking services for farmer-owned cooperatives. CoBank, ACB, is the only ACB in the Farm Credit System.
Farm Credit Bank (FCB) FCBs were created on July 6, 1988, in 11 of the 12 then existing Farm Credit districts when the Federal Land Bank and Federal Intermediate Credit Bank in each district merged. The mergers were required by the Agricultural Credit Act of 1987. FCBs provide services and funds to local Associations that, in turn, lend those funds to farmers, ranchers, producers and harvesters of aquatic products, rural residents for housing, and certain farm-related businesses. Since 1988, mergers between FCBs have reduced their number to six.
Federal Land Credit Association (FLCA) The Agricultural Credit Act of 1987 authorized a Farm Credit Bank to transfer its direct lending authority for long-term mortgage loans to a Federal Land Bank Association. These Associations are designated as FLCAs. Unlike a Federal Land Bank Association, an FLCA owns its loan assets. An FLCA obtains funds from a Farm Credit Bank to make and service long-term mortgage loans to farmers and ranchers, and to rural residents for housing. An FLCA also makes loans to these borrowers for basic processing and marketing activities, and to farm-related businesses.
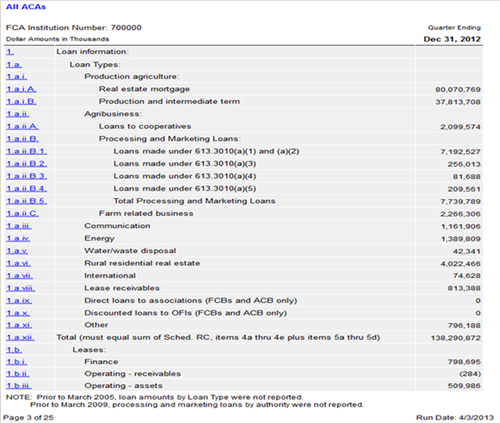
An example report is provided in Figure 5. It represents the third spreadsheet within the Summary for Lending Types Report for ACAs in 2012. The information captured for purposes of measuring farm sector debt would be items 1.a.i.A Production Agriculture, real estate mortgage and 1.a.i.B Production Agriculture, Production and intermediate term. The same spreadsheet is accessed for each of the other FCA institutions to obtain the total amount of lending to production agriculture.
Figure 5. Example of Farm Credit System, summary by lending type report
Commercial Banks
Commercial banks hold both real estate and nonreal estate agricultural sector debt. Historically, nonreal estate debt has represented a larger share of commercial bank agricultural debt holdings. The Board of Governors of the Federal Reserve System (FRB) further classifies commercial banks as either agricultural or nonagricultural. According to the FRB definition a bank is considered agricultural if its ratio of farm loans to total loans exceeds the un-weighted average of the ratio at all banks on a given date. Because the goal of the Farm Sector Balance Sheet is to represent a snapshot of all farm sector debt, no distinction is made between agricultural sector debts held in agricultural or nonagricultural commercial banks.
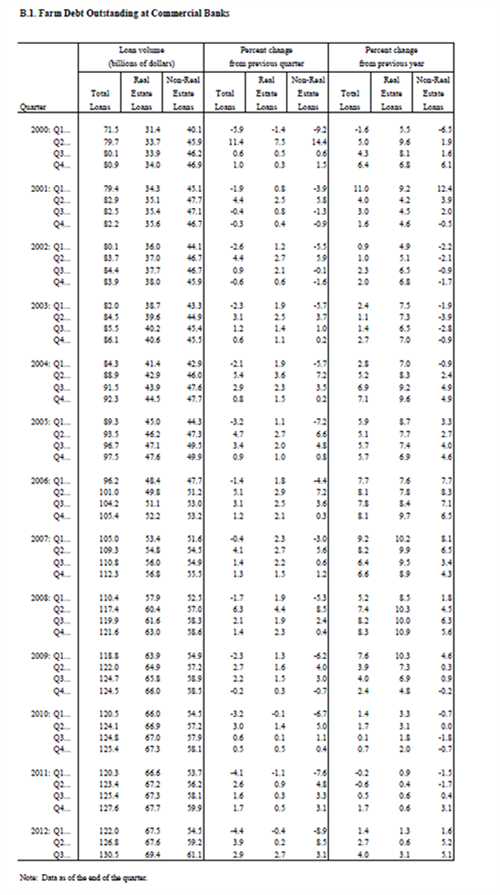
The Agricultural Finance Databook is a quarterly compilation of national and regional agricultural finance data derived from quarterly surveys of bankers and call report data. Beginning in mid-2000, the Federal Reserve Bank of Kansas City took over publication of the report that was formerly published by the Federal Reserve Board of Governors. The information used to represent Commercial Bank lending to production agriculture come from Section B: Selected Statistics from the Quarterly Reports of Condition of Commercial Banks.
The Federal Deposit Insurance Corporation (FDIC) is responsible for overseeing insured financial institution adherence to FFIEC reporting requirements, including the observance of all bank regulatory agency rules and regulations, accounting principles and pronouncements adopted by the Financial Accounting Standards Board (FASB) and all other matters relating to a call report submission. Call reports are required by statute and collected by the FDIC under the provision of Section 1817(a)(1) of the Federal Deposit Insurance Act. The FDIC collects, corrects, updates and stores call report data submitted by all insured national and state nonmember commercial banks and state-chartered savings banks on a quarterly basis (see: https://cdr.ffiec.gov/public/). Call reports data are a widely used source of timely and accurate financial data regarding a bank's financial condition and the results of its operations. The content and structure of Call report are frequently revised in consideration of developments in the banking industry and changes in supervisory, regulatory, and analytical needs. Specific guidelines and reporting requirements are provided by the Federal Financial Institutions Examination Council (FFIEC) (https://www.ffiec.gov/forms031.htm). A recent change in reporting that will impact how data are assembled for the farm sector balance sheet was the conversion of reporting requirements for savings associations from the Thrift Financial Report to the Call Report effective March 31, 2012. As a result of this change, farm sector debt held by savings associations is now counted under the commercial bank lender group as opposed to the individuals and others category.
Figure 6. Example of Agricultural Finance Databook, Section B report
Farmer Mac
The Federal Agricultural Mortgage Corporation (Farmer Mac) is a Government-sponsored enterprise with the mission of providing a secondary market for agricultural real estate mortgage loans, rural housing mortgage loans, and rural utility cooperative loans. Congress established Farmer Mac in the Agricultural Credit Act of 1987 to provide a source of long term fixed rate mortgage credit to the farm sector. Creation of Farmer Mac was one response to the farm crisis of the 1980s when large surpluses, falling farm prices and land values, and rapidly rising inflation caused many farmers to default on loans they had taken out during the prosperous years of the 1970s. The crisis was severe enough to threaten the viability of the Farm Credit System from which many farmers had received their loans.
Farmer Mac conducts its business primarily through two programs:
- Farmer Mac I, in which Farmer Mac purchases, or commits to purchase, qualified agricultural or rural housing mortgage loans, or obligations backed by qualified loans
- Farmer Mac II, in which Farmer Mac purchases the portions of qualified loans that are guaranteed by the U.S. Department of Agriculture
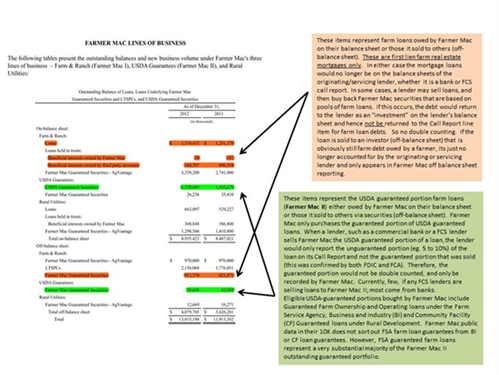
Farmer Mac guarantees the timely payment of principal and interest on securities backed by qualified loans or guaranteed portions, and either retains those securities in its portfolio or sells them in the secondary capital markets. Securities retained in the Farmer Mac portfolio and serviced by the institution are not reported by originating lenders who no longer hold the debt. Source data on farm loan activities by Farmer Mac are obtained from the U.S. Securities and Exchange Commission (SEC) annual 10K filings. Figure 9 provides guidance on the specific elements of the reports that are captured and reported as part of farm sector debt.
Figure 7. Interpretation of Farmer Mac SEC reports
Life Insurance Companies
Historically, agricultural real estate mortgages have been an important investment for life insurance companies, which in turn have been a key source of farm real estate loan funds. The life insurance industry’s relationship with agriculture has changed considerably since the farm financial crisis of the early to mid-1980s. In spite of the changes, life insurance companies have been resilient lenders to the farm sector by continuing to originate a significant volume of farm loans during both the financial highs and lows experienced by agriculture through the years.
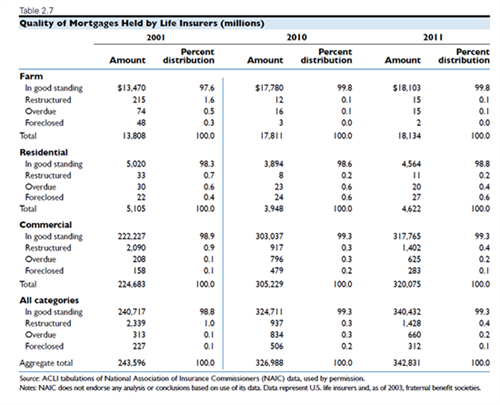
Data on farm mortgages held by life insurance companies is collected from Life Insurers Fact Book complied by the American Council of Life Insurers (ACLI). The Life Insurers Fact Book provides information on trends and statistics about the life insurance industry. ACLI represents more than 300 legal reserve life insurer and fraternal benefit society member companies operating in the United States. These member companies represent over 90% of the assets and premiums of the U.S life insurance and annuity industry. Data in the Life Insurers Fact Book come from the annual statements of life insurers filed with the National Association of Insurance Commissioners (NAIC). These data represent the U.S. insurance business of companies (or branches of foreign companies) regulated by state insurance commissioners.
The six companies (AEGON USA, Citigroup Investments AgriFinance, Lend Lease Agri-Business, Metropolitan Life, MONY Life Insurance, and Prudential) currently active in farm lending account for more than 90 percent of the industry’s farm mortgages and generally have high total asset holdings and large farm mortgage portfolios. The life insurance industry’s relationship with agriculture has grown more complicated beginning in the mid-1980s with the direct acquisition of farmland in addition to expanding farm loan portfolios. For example, loans to agribusiness and timber interest comprise an increasing share of the “agriculture” or farm loan portfolio, particularly for Metropolitan Life. Data reported in the Life Insurers Fact Book for farms includes loans to these interests which are qualified as outside the farm sector. Administrative information from individual insurers puts the adjustment to approximately 30 percent of total loans.
Figure 8. Example of life insurance fact book table.
Farm Service Agency
The USDA’s Farm Service Agency (FSA) serves as the nation’ s lender of last resort by providing loans to family-size farmers unable to obtain credit at reasonable rates and terms despite having adequate repayment capacity and collateral. FSA serves these farmers through its direct and guaranteed farm loan programs (FLPs). The guaranteed FLP has been emphasized since 1985 and guarantees loans made by commercial creditors to farmers meeting FSA eligibility criteria. The direct FLP, which primarily consists of operating (OL) loans, real estate-secured farm ownership (FO) loans, and emergency disaster (EM) loans, is generally considered to be for less creditworthy farmers who are unable to obtain credit from commercial creditors even with a guarantee. Direct loan funds are also set aside each year for loans to minority applicants and beginning farmers.
The Farm Service Agency provides confidential administrative data summaries to ERS for farm program loan obligations as of December 31 for several different programs (FLP’s). These include: operating loans, ownership loans, emergency loans, economic emergency loans, and soil and water loans.
Operating loans may be used to purchase items such as: livestock and feed; farm equipment; fuel, farm chemicals, insurance and other operating costs, including family living expenses; minor improvements or repairs to buildings; refinance certain farm-related debts, excluding real estate. The maximum loan amount for a Microloan is $35,000. The maximum loan amount for a Direct Farm Operating Loan is $300,000. There is no down payment requirement. Microloans are direct farm operating loans with a shortened application process and reduced paperwork designed to meet the needs of smaller, non-traditional, and niche type operations.
FSA’s Direct Farm Ownership loans provide farmers and ranchers the opportunity to: purchase farmland, construct and repair buildings, make farm improvements. The maximum loan amount for a Direct Farm Ownership Loan is $300,000. There is no required down payment.
USDA's Farm Service Agency (FSA) provides Emergency loans to help producers who own or operate located in a county declared by the President or designated by the Secretary of Agriculture as a primary disaster area or quarantine area. Emergency loan funds may be used to: restore or replace essential property, pay all or part of production costs associated with the disaster year, pay essential family living expenses, reorganize the farming operation, refinance certain debts, excluding real estate. The maximum loan amount for an Emergency loan is $500,000.
The real estate, non-real estate loan distinction for FSA direct lending is approximated by combining the administratively reported categories as follows:
Equation 12

Equation 13

The U.S. Department of Agriculture (USDA) Farm Service Agency (FSA) Farm Storage Facility Loan Program (FSFL) provides low-interest financing for producers to build or upgrade farm storage and handling facilities. The FSA is authorized to implement the program through USDA's Commodity Credit Corporation (CCC). ERS receives confidential administrative data that summarizes the balances for storage facility loans on December 31.
Survey Data
Individuals and Others
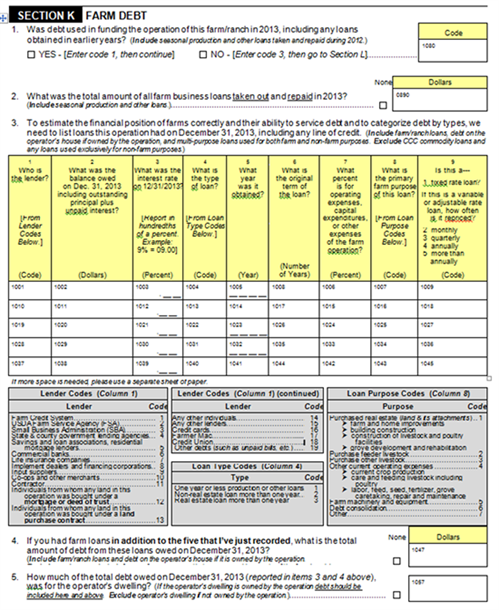
The Agricultural Resource Management Survey (ARMS) is used as a data source for debt held by individuals and other types of lenders and to make adjustments to administrative data. Figure 9 provides an example of the questions used by the ARMS to obtain information on farm debt. The lender category of individuals and others as reported on the farm sector balance sheet would include: the Small Business Administration (SBA); State and county government lending agencies; implement dealers and financing corporations; input suppliers; co-operatives and other merchants; individuals from whom any land was bought under a mortgage or deed of trust; individuals from whom any land was bought under a land purchase contract; credit unions; any other individuals; any other lenders; credit cards; other debts and unpaid bills.
Figure 9. Debt information collected on the ARMS
Adjustment for Farm Purpose and Dwellings
Two adjustments are made to sector-level debt estimates reported by lenders to more accurately reflect debt owed for farm business purposes. The balance sheet methodology requires that farm sector assets and debts exclude those attributed to operator households. Therefore, the first adjustment reduces the estimate of real estate debt by the share of mortgage debt attributed to operator dwellings. The second adjustment reduces lender-reported debt by the share of farm loans that is used for purposes unrelated to farm business activities. To ensure balance between asset and debt values, just as debt for dwellings and nonfarm uses is excluded from the sector estimate of farm business debt, the value of dwellings or the value of any farmer or farm household asset for which debt is secured using farm assets is excluded from the measure of sector assets.
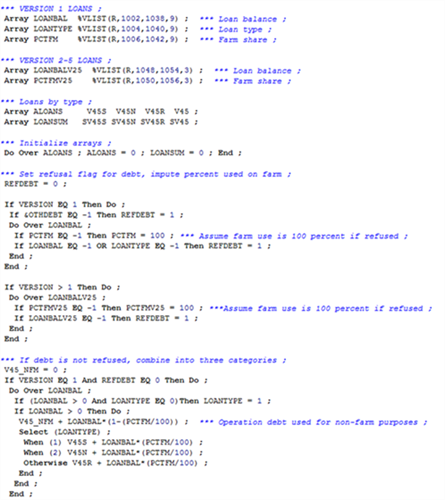
To ensure that loan balances reflect debt being used to support production agriculture activities, the ARMS collects information to account for the purpose of reported loans by major lender. This information is used to adjust ending balances for both real estate and non-real estate debt. For real estate debt, the amount of debt reported for non-farm purposes is excluded from the routine summarization of debt in the ARMS summary analysis. The variable 45R (figure 10) represents the total amount of real estate debt for farm purposes.
Figure 10. Sample SAS code on estimating the farm share of debt
The other adjustment to real estate debt is to deduct the amount of debt associated with operator dwellings (U.S. Department of Agriculture, ERS, Handbook No. 671). Dwelling debt as a share of total real estate debt can be summarized across all lenders as well as for individual lender categories. The results for all lenders are used as the default adjustment, unless statistically significant differences result for specific lenders. Using 2011 as an example, the debt attributed to dwellings across all lenders (for all survey versions) was 14.99 percent (Figure 11). For each year, paired t-tests were used to determine lender groups that had a statistically significant difference from all lenders.
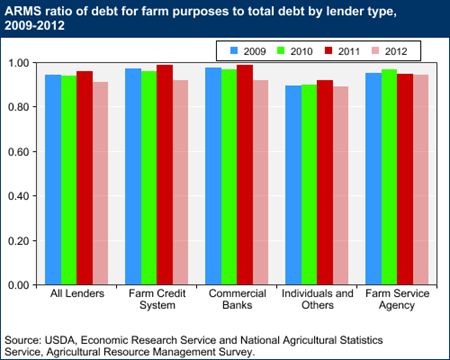
For non-real estate debt, the percentage of debt that is designated as being for farm purposes is summarized across all lenders and for each major lender. For all lenders, the shares ranged from a low of 91.2 percent (2012) to a high of 96.1 percent (2011) from 2009-2012. Data on individual lender types is summarized in Figure 11b. Again, paired t-tests were performed for each year to determine if any lender’s reported non-farm purpose share was statistically different.
Figure 11a. ARMS ratio of household debt to total farm debt by lender type, 2009-2012
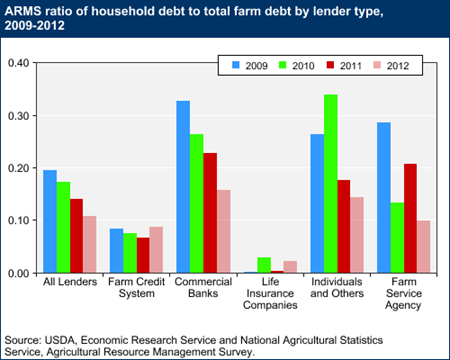
Figure 11b. ARMS ratio of debt for farm purposes to total debt by lender type, 2009-2012
Balance Sheet Glossary
American Council of Life Insurers (ACLI)
Organization representing more than 300 legal reserve life insurer and fraternal benefit society member companies operating in the U.S. Members account for over 90% of the assets and premiums of the U.S. life insurance industry. The ACLI produces the Life Insurers Fact Book, which is used to gather data on farm mortgages held by life insurance companies.
Agricultural Finance Databook
The Agricultural Finance Databook is compiled quarterly by the Federal Reserve Bank of Kansas City and comprises national and regional agricultural finance data. Information from the Quarterly Reports of Condition of Commercial Banks, Section B: Selected Statistics, is used to measure the commercial lending to production agriculture in balance sheet estimates.
Agricultural Resource Management Survey (ARMS)
The Agricultural Resource Management Survey is the USDA’s primary source of Information on the economics of operating farm businesses and the characteristics of farm operators and their households. The data is collected via a representative sample of the contiguous United States on an annual basis.
Assets
Anything owned by those engaged in production agriculture that has a monetary or exchange value. All assets are reported on the farm sector balance sheet at market value.
Balance Sheet
A condensed financial statement showing the nature and amount of a company's assets, liabilities, and capital on a given date. Unlike the other financial statements, it is accurate only at one moment in time, not a period of time. A balance sheet is a listing of the items making up the two sides of the accounting equation: Assets = Liabilities + Owner's Equity.
Call Report
Financial reports required of Commercial Banks and Savings Associations by statute and collected by the FDIC under provision of section 1817(a)(1) of the Federal Deposit Insurance Act. Call reports are a direct data input to the Agricultural Finance Databook statistics used to measure commercial lending to production agriculture in Balance Sheet estimates.
Commodity Credit Corporation (CCC)
The Commodity Credit Corporation is a wholly owned federal corporation within the U.S. Department of Agriculture formed to finance price supports for agricultural commodities. The objectives of the CCC are to stabilize and support income and commodity prices. In addition, the CCC facilitates the distribution and the balanced supply of agricultural commodities.
Debt
Debt refers to claims on a firm’s assets by creditors who make capital available for use in the business. The balance sheet debt estimates refer to farm-level debt owed by the business and therefore excludes debt owed by others. Lender type classifications on the balance sheet report debt where held rather than issued.
Debt Repayment Capacity Utilization (DRCU)
Debt Repayment Capacity Utilization is a measure taking into account debt obligations in relation to maximum debt repayment capabilities. It is defined as the maximum debt that can be supported by net cash income available for loan repayment. The indicator is often used as an indicator of financial stress.
Equity
Equity refers to the funds contributed by farm business owners or stockholders to firm operations. Equity also includes earnings retained by owners and shareholders. Equity is equal to the difference between asset values and debt.
Farm Credit System (FCS)
A system of federally chartered, but privately owned, banks and associations that lend primarily to agricultural producers and their cooperatives. The System is organized as a cooperative. The System is supervised and regulated by the Farm Credit Administration, an agency in the executive branch of the U.S. government.
Farmers Service Agency (FSA)
A U.S. government agency operating under the authority of the U.S. Department of Agriculture. Programs principally provide or guarantee credit for agricultural and rural borrowers who show promise for financial viability but are unable to independently obtain financing from commercial sources. Loan programs include direct loans and partial guarantees of loans made by commercial lenders.
Farm Storage Facility Loan Program
A program of the FSA providing low-interest financing for producers to build or upgrade farm storage and handling facilities. The FSA implements the program via the USDA’s Commodity Credit Corporation.
Farm Sector Value-added Accounts
The USDA Farm Sector Value-added accounts measure the value-added to the economy by agriculture at the sector level. According to national income accounting standards farm sector value-added accounts is the value of farm sector production minus the value of intermediate goods used.
Federal Agricultural Mortgage Corporation (Farmer Mac)
Farmer Mac is a government-sponsored enterprise established as part of the Agricultural Credit Act of 1987. Farmer Mac functions to provide a secondary market for agricultural real estate mortgage loans, rural housing mortgage loans, and rural utility cooperative loans by purchasing the entirety of certain qualifying loans (Farmer Mac I) or the portions of qualified loans backed by the USDA (Farmer Mac II). Data on debt held by Farmer Mac is obtained from the enterprise’s U.S. Securities and Exchange Commission (SEC) annual 10k filing.
Individuals and Others Debt Classification
The individuals and others debt classification includes debt held by the Small Business Administration, State and County government lending agencies, implement dealers and financing corporations, input suppliers, co-operatives and other merchants, credit unions, Farmer Mac, credit cards, and individuals from whom land was bought under a land purchase contract, mortgage, or deed of trust. The individuals and other debt category also include any other debts and unpaid bills to individuals or lenders. Prior to March 31, 2012 debt held by Savings associations was also included in this classification. Savings association data is now reported with data on commercial banks due to due to regulatory changes requiring these institutions to submit data to the FDIC via the Call Report.
Life Insurers Fact Book
The Life Insurers Fact Book is compiled by the American Council of Life Insurers to provide information on trends and statistics about the life insurance industry. Life Insurers Fact Book serves as the data source for farm mortgages held by life insurance companies.
Storage Facility Loans
The U.S. Department of Agriculture (USDA) Farm Service Agency (FSA) Farm Storage Facility Loan Program (FSFL) provides low-interest financing for producers to build or upgrade farm storage and handling facilities. The FSA is authorized to implement the program through USDA's Commodity Credit Corporation (CCC). ERS receives confidential administrative data that summarizes the balances for storage facility loans on December 31.
Uniform Call Report (UCR)
Financial reports required of members of the Farm Credit System (FCS) by the Farm Credit Administration. The FCA compiles UCRs in several reports including the Summary by Lending Type Reports, which is used as a source of information on farm sector debt held by FCA member institutions.
References
U.S. Department of Agriculture, National Agricultural Statistics Service, 1999, Agricultural Economics and Land Ownership Survey, Volume 3, Special Studies Part IV (AC97-SP-4).
U.S. Department of Agriculture, Economic Research Service.1989.Major Statistical Series of the U.S. Department of Agriculture, The Balance Sheet, Agricultural Handbook, No. 671, Vol. 11, May.