

U.S. Consumers Spent More on Food in 2022 Than Ever Before, Even After Adjusting for Inflation

The USDA, Economic Research Service’s (ERS) Food Expenditure Series (FES) provides a comprehensive measure of the total value of all food purchases in the United States. The series tracks spending on food intended to be prepared at home, such as from grocery stores, and food that is prepared away from home, such as at restaurants. The FES allows Government agencies, academic researchers, and industry stakeholders to assess and track developments in consumer food-buying behaviors and the U.S. food supply.
ERS published the 2022 update to the FES in June 2023 and publishes monthly updates with data delayed by 2 months. The monthly series by outlet type was added to the series in February 2023 and will be updated every year. In May 2023, ERS published State-level food expenditure estimates using a different underlying dataset but following a similar methodology to the national-level series. The State-level food expenditure estimates lag by 2 years.
Food Expenditure Series Shows Changes in Food Spending Trends
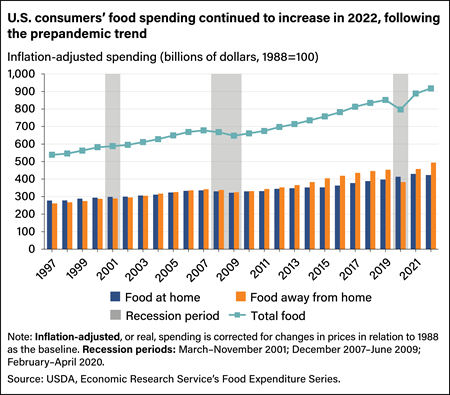
Real, or inflation-adjusted, annual food spending in the United States increased 70 percent from 1997 to 2022 to the highest level recorded. The 25-year climb was steady other than slight decreases during the Great Recession in 2008 and 2009 and a 6.4-percent annual drop in 2020, during the Coronavirus (COVID-19) pandemic. Spending on food at home (FAH) and food away from home (FAFH) increased from 1997 to 2022, but FAH rose at a slower rate (53 percent) than FAFH, which increased 89 percent. Real total food spending increased 11.4 percent in 2021 and 3.4 percent in 2022, driven by higher FAFH spending (up 19 percent in 2021 and 8 percent in 2022). Real FAH spending increased by 4 percent in 2021 but decreased by 2 percent in 2022.
FAH and FAFH Spending Shares Returned to Prepandemic Trends
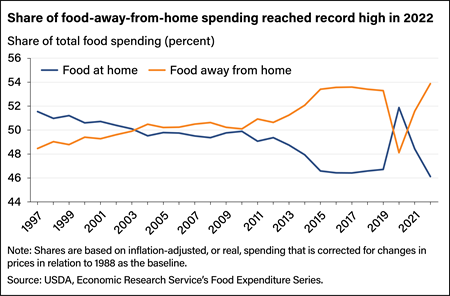
In 2022, real expenditures at FAFH establishments accounted for 53.9 percent of total food spending, the largest share since ERS began tracking this data. The remaining 46.1 percent of total food spending occurred at FAH outlets. The share of food expenditure is not proportionate to the amount of food purchased, because food away from home generally is priced higher than food purchased for home preparation. FAFH establishments must pay labor costs for workers to prepare and serve food, as well as for overhead expenses such as buildings, equipment, and utilities. The away-from-home market share has grown over the last two decades, other than slight spending decreases after the Great Recession and a 9.7-percent annual drop in 2020. The decline in 2020 was the first time FAFH made up less than half of total food spending since 2004.
FAH and FAFH Spending Patterns Varied Across Outlet Types During and After Pandemic
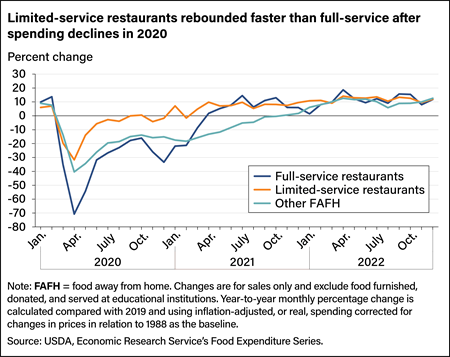
The COVID-19 pandemic greatly affected the food service industry. Spending at full-service restaurants declined 71 percent in April 2020 compared with April 2019. Limited-service restaurants saw a drop in spending of 32 percent, and all other food-away-from-home establishments, such as drinking places, hotels, and motels, recorded a 40-percent decrease in April 2020 compared with April 2019. Full-service restaurants typically offer food and alcohol to seated customers who pay after eating and offer amenities such as nondisposable dishware and utensils. Limited-service, or fast-food, restaurants prioritize convenience and have limited menus, sparse dining amenities, and no wait staff. The limited physical interaction with customers made it easier for fast-food establishments to adapt to COVID-19 restrictions, and by the second half of 2020, they managed to recover to spending levels seen before the pandemic. Despite adapting with expanded takeout and delivery services, full-service restaurants took longer to rebound, returning to prepandemic spending levels in April 2021. By November 2021, all three types of FAFH outlets had surpassed 2019 levels at different rates, and by December 2022, all three were each 12 percent higher than in December 2019.
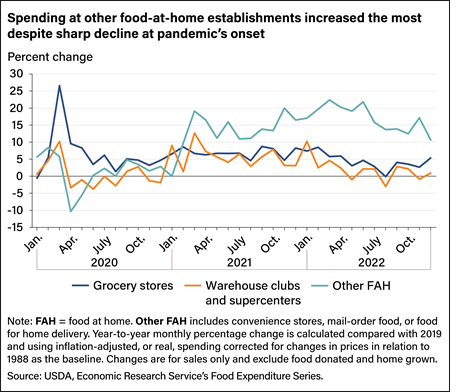
In the case of FAH, consumers responded to the pandemic by stocking up on food and supplies. Spending at grocery stores in April 2020 increased by 10 percent compared with April 2019. However, this was not the case at warehouse clubs and supercenters, which saw spending decrease by 3 percent, and other FAH establishments, such as convenience stores and mail order and home delivery, which saw spending decrease by 10 percent.
Spending at grocery stores has since leveled off. During 2021 and 2022, spending increased an average of 6 percent at grocery stores and 4 percent at warehouses and supercenters. Interestingly, other FAH establishments that were hit hard at the onset of the pandemic saw spending levels 15 percent higher in 2021 and 2022 than they were in 2019. This suggests that consumers’ preferences for where they shop for food shifted during the pandemic. In the early days of the pandemic, consumers were concerned about potential shortages and sought out the convenience and reliability of grocery stores. However, as the pandemic progressed, consumers became more comfortable with shopping at other types of establishments, such as warehouse clubs and convenience stores. Many of these establishments offer services that were in high demand during the pandemic, such as delivery and curbside pickup, that make it easier for consumers to shop for food while limiting contact with others.
Food Price Changes Can Influence the Way Consumers Spend
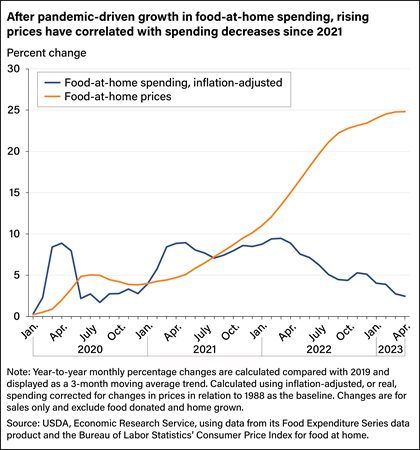
Because food is undeniably an essential aspect of our lives, it’s no surprise that when food prices increase, food spending generally follows suit. Even so, the magnitude of this spending increase is contingent upon how households react and adapt to the higher prices. When faced with rising food prices, households use various budget-management strategies. Some households may opt to buy less food overall, they may eat out less to reduce consumption of discretionary items, or they may seek out lower-cost alternatives.
Total food prices rose almost 10 percent in 2022, more than three times the 20-year (2003–22) average. Prices for food bought at grocery stores and other FAH outlets rose even faster at 11.4 percent in 2022, so real spending on FAH experienced a corresponding decline. Households may have made conscious choices to limit their FAH consumption or sought alternative, more affordable food options. Despite the decrease in year-to-year growth of real FAH spending in both 2022 and 2023, it is crucial to note that spending levels consistently remained above those in 2019. This resilience in spending indicates that, even as the pace of expenditure growth slowed, consumers spent 46 percent of their food budgets on FAH in 2022.
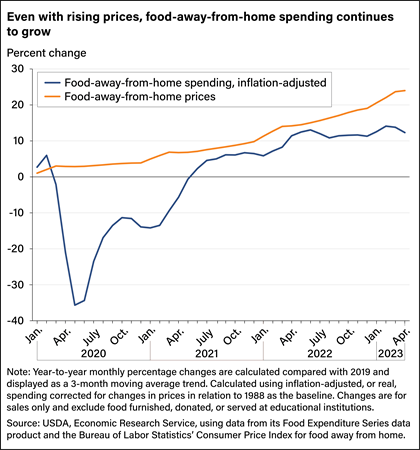
The pandemic drove a significant decline in real FAFH spending in 2020, but spending rebounded in 2021, surpassing 2019 levels by midyear. Several factors contributed to this resurgence, including the reopening of restaurants, the availability of increased takeout options, and the return to work for many people. In 2022, the growth in FAFH spending compared with 2019 remained relatively stable at an average of 11 percent. This occurred even though FAFH prices continued to rise at an average rate of 15.5 percent in 2022 compared with 2019.
These trends suggest that consumers were willing to increase the share of FAFH spending in their budgets, even with rising prices. Moreover, while some households may have adjusted their FAFH consumption in response to rising prices, wage growth or improved economic conditions may have resulted in more disposable income for others. This increased financial flexibility could have allowed some households to maintain or even increase their FAFH spending despite higher prices.
Food Spending Varies Across U.S. States
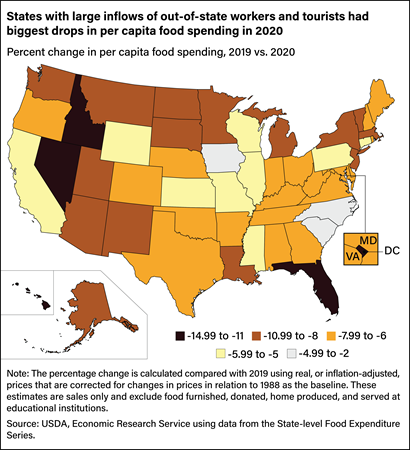
ERS’ newly developed State-Level Food Expenditure Series helps illustrate annual food spending changes across all 50 States and Washington, DC, since 1997. Individual States experienced varying degrees of decline in food spending in 2020, the latest year of available data. From 2019 to 2020, every State and Washington, DC, saw decreases in inflation-adjusted, per capita total food spending. The smallest decreases in food spending were in Iowa (2.2 percent), South Carolina (2.6 percent), and North Carolina (4.1 percent). The States with the largest decreases were Hawaii (15 percent), Washington, DC, (13.9 percent), Florida (11.8 percent), and Nevada (11.6 percent). These States typically have large inflows of people from out of State as nonresident workers and tourists. For example, Washington, DC, despite showing an overall decline in spending, had higher per capita sales at FAFH establishments than the State average from 1997 to 2020, although the gap narrowed over time. Delaware recorded a food spending decrease of 7.2 percent, which was the median for the country.
Food Expenditure Series, by Eliana Zeballos and Wilson Sinclair, USDA, Economic Research Service, February 2024
Estimating the State-Level Food Expenditure Series, by Eliana Zeballos and Wilson Sinclair, ERS, April 2023
Food Spending by U.S. Consumers Fell Almost 8 Percent in 2020, by Eliana Zeballos and Wilson Sinclair, USDA, Economic Research Service, October 2021
Food Price Outlook, by Matthew MacLachlan and Megan Sweitzer, USDA, Economic Research Service, April 2024
ERS Data Products Show Food-At-Home Price Inflation From Producers to Consumers, by Megan Sweitzer, Matthew MacLachlan, Wilson Sinclair, Alexander Stevens, Hayden Stewart, James Chandler Zachary, and Eliana Zeballos , USDA, Economic Research Service, July 2023