

ERS’s Supplemental Nutrition Assistance Program Policy Index Captures State Differences in Program Administration

USDA's Supplemental Nutrition Assistance Program (SNAP) is the Nation’s largest food assistance program and served an average of 44.2 million individuals per month in 2016. For much of the program’s history, the administration of SNAP was largely uniform across States. Prospective participants applied for assistance at local welfare offices, providing proof of residence, income, and assets.
However, with passage of welfare reform legislation in 1996, along with other legislative and regulatory changes, States now have increased flexibility in how they administer some components of the program. States have more options to simplify program requirements, thereby reducing the time burden of administering the program and applying for benefits. As examples of the flexibility States have been given, by 2002, States had been granted the option to introduce online applications and use a “simplified reporting” option that reduces requirements for reporting changes in a household’s financial circumstances. As of 2014, 38 States had adopted an online application system, and all States had adopted some form of simplified reporting. State-level flexibility in administering SNAP can influence who and how many people qualify and apply for benefits.
State SNAP Policies Have Become More Accommodative Over Time
ERS researchers recently developed a SNAP policy index that reflects how accommodative, or encouraging, State policies are to enrolling potential SNAP applicants. The index is composed of 10 State policies, which previous research indicates have statistically and economically significant impacts on the SNAP caseload. The 10 policies can be grouped into those related to:
- Eligibility for benefits,
- Ease of enrolling and continuing benefits (time and money transaction costs),
- Stigma associated with participating in the program, and
- Outreach to attract new participants.
The index is the sum of the 10 policies—7 policies that tend to increase SNAP caseloads and 3 policies that have a negative impact on SNAP caseloads. The seven policies that would raise SNAP participation include online applications and simplified reporting, as previously discussed. Another three policies relate to whether vehicles can be exempted from the SNAP asset test, or whether the asset or gross income limits have been relaxed to align with requirements for the State’s cash assistance program. Two final policies relate to the rollout of electronic benefit transfer cards for SNAP benefits and whether the State had a federally funded radio or TV ad campaign to raise awareness of SNAP. The three policies expected to discourage people from applying for and receiving benefits include eligibility restrictions for adult noncitizens, requiring households to recertify for benefits every 1-3 months, and requiring applicants to be fingerprinted.
The index ranges between 1 and 10. An index of 1 indicates that the State has none of the 7 positive policies in place and has 3 negative policies. A 10 indicates the State employs the 7 positive policies and none of the negative ones.
ERS researchers calculated indexes for all 50 States and the District of Columbia for the years 1996 to 2014. The researchers found that SNAP policies became more accommodative toward enrollment in the SNAP program in every State and in the District of Columbia. The largest increase in the index occurred in New York, where the index moved from 2.3 to 8.6, while the smallest change occurred in Alaska, where the index went from 3.8 to 6.5.
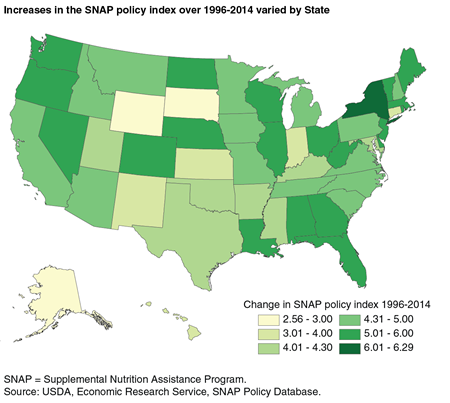
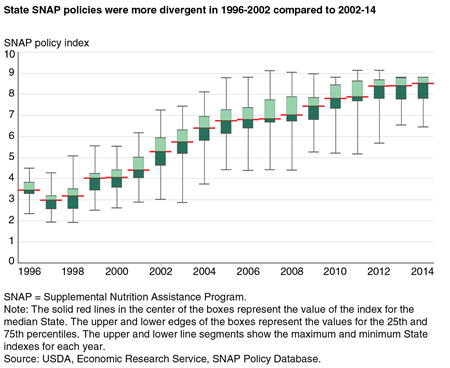
State Policies Diverged From 1996 to 2002, Then Converged From 2002 to 2014
During 1996-2002, some States acted faster than others in adopting more accommodative policies. For example, the District of Columbia, Louisiana, Massachusetts, New Hampshire, and New York had the greatest change in their SNAP indexes, which rose by more than 3 points between 1996 and 2002. In 1996, State SNAP policy indexes ranged from 2.3 (New York) to 4.5 (Montana), compared with the larger range from 3.0 (California) to 7.3 (Michigan) in 2002. A larger range indicates more spread across States in their SNAP policies.
The divergence lessened somewhat between 2002 and 2014, as additional States adopted more accommodative rules, though there was still greater variation in State SNAP policies in 2014 than in 1996. The value of the index for the median State—the State where half the States and the District of Columbia have a lower index and the other half a higher index—rose from 3.5 in 1996 to 8.5 in 2014, meaning that by 2014, the median State adopted 5 more accommodative policies on net than it had in 1996. The gap between States at the 25th and 75th percentiles was 0.5 in 1996, peaked in 2002 at 1.3, and was 1.0 in 2014. Thus, at the end of 2014, the 75th and 25th percentile States differed by around 1 policy.
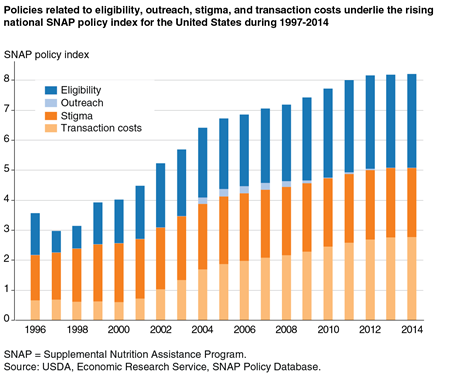
Largest Shifts Occurred in Policies Related to Eligibility and Transaction Costs
The national average across the States of the SNAP policy index grew steadily from 1997 to 2014. Between 1997 and 2000, policies that were more accommodating to eligibility and that reduced stigma played the largest roles in the increase in the index. During this time, almost all States instituted at least one policy that relaxed eligibility requirements. By December 2000, 33 States provided all SNAP benefits through electronic benefits transfers, a format less likely to draw attention to and stigmatize the person redeeming the benefits in grocery stores, up from 12 States in December 1997.
After 2000, policies that reduced transaction costs, such as allowing participant households to maintain benefits for longer than 3 months before having to recertify, played a larger role in the increase in the index. Federally funded radio or television ads raising awareness of SNAP, which ran from 2004 to 2012, had a small positive impact on the national index.
For a complete description of ERS’s SNAP policy index see, SNAP Policy Database: Interactive Tool.
Using a Policy Index To Capture Trends and Differences in State Administration of USDA's Supplemental Nutrition Assistance Program, by Brian Stacy, Laura Tiehen, and David Marquardt, ERS, February 2018