

Managing Agricultural Risk Under Different Scenarios: Selected 2014 Farm Act Programs
Highlights:
-
Differences in price-based formulas for calculating expected payments across commodity support programs help explain why more acres of corn and soybeans were enrolled in Agriculture Risk Coverage, while most acreage in rice was enrolled in Price Loss Coverage over the period of the 2014 Farm Act.
-
Higher expected returns led more upland cotton producers to purchase the Stacked Income Protection Plan (STAX) over the Supplemental Coverage Option in 2015 and 2016, though overall purchases of STAX were still lower than purchases of other cotton-eligible insurance programs.
-
Around 60 percent of dairy producers enrolled in the Margin Protection Program for Dairy Producers to reduce risk exposure to low milk prices and/or high feed costs.
The Agricultural Act of 2014 (Farm Act) introduced several new programs for crop and livestock producers. These programs exist on top of Federal crop insurance programs already in place that provide the bulk of government commodity support to U.S. agricultural producers.
Risk Management in Agricultural Production
Uncertainties inherent in agricultural production and prices affect producers’ revenues, both positively and negatively. Changes in worldwide supply and demand that lift prices, as well as favorable local weather conditions, can lead to higher producers’ revenues. Global market forces can also push prices downward, while local extremes in rainfall, temperatures, pests, and disease can reduce producer revenues.
Producers react to production uncertainty in several ways. They adjust what crops they choose to plant, how many acres to plant, and what quantity of inputs (e.g., fertilizers and chemicals) to use. They invest in technologies, like irrigation or heat- and drought-resistant seeds that increase crop resilience to extreme weather outcomes. And they maintain personal savings to self-insure against crop failures.
To manage price risk, producers can participate in futures and options markets to lock in prices at harvest time. Grain storage and marketing loan programs also offer a means to manage price and production volatility from year to year. Finally, many producers supplement farm income with off-farm earnings to provide added stability to their total income.
Beyond these measures, however, producers often participate in a range of farm risk management programs offered by the Federal Government. Over the last several years, the largest program in budgetary terms has been the Federal crop insurance program (FCIP). Each year, eligible producers of around 130 crops can choose from a variety of FCIP products that can mitigate losses from low yields (e.g., Yield Protection (YP)) or low revenues (e.g., Revenue Protection (RP) or Revenue Protection with Harvest Price Exclusion (RP-HPE)). According to USDA’s Risk Management Agency, these products account for 85 percent of all crop insurance policies sold. In 2015, 57 percent of total enrolled acres and 72 percent of total liabilities were in corn, soybeans, wheat, and cotton. Based on their needs and appetite for risk, producers enrolled in these products select a coverage level per acre (ranging from 50 to 85 percent) and the number of acres to enroll. A portion of the premium—on average, 62 percent—is subsidized by the Government.
Other Risk Management Tools for Crop Producers
Unlike the 1996, 2002, and 2008 Farm Acts, the 2014 Farm Act does not offer fixed, direct payments based on producers’ historic crop acreage. Instead, it includes several programs that address unexpected shortfalls in prices, yields, and profit margins. For crop producers, these programs include Agriculture Risk Coverage (ARC), Price Loss Coverage (PLC), Supplemental Coverage Option (SCO), and the Stacked Income Protection Plan (STAX). Crops eligible for ARC and PLC—known as covered commodities—include corn, soybeans, wheat, rice, peanuts, grain sorghum, oats, barley, other oilseeds, chickpeas, dry peas, and lentils. STAX offers coverage for upland cotton producers. SCO is available for a variety of crops, including most covered commodities and upland cotton.
Producers of covered commodities enrolled in either ARC or PLC commit to them for the duration of the Farm Act (i.e., through 2018). The coverage cycles for SCO and STAX are 1 year with an annual purchase decision.
Agriculture Risk Coverage and Price Loss Coverage
Agriculture Risk Coverage has two variants, individual coverage (ARC-IC) and county coverage (ARC-CO). ARC-CO covers up to 10 percent of county losses when county revenue falls below 86 percent of the county benchmark revenue. This benchmark is the Olympic average (the average with the highest and lowest values omitted) of national prices and county-specific yields of the previous 5 years. Payments are equal to the difference between 86 percent of benchmark revenue and the actual revenue, multiplied by 85 percent of base acres (acres historically planted on the farm). Since ARC-CO had substantially higher enrollment than ARC-IC (76 percent of all base acres were enrolled in ARC-CO, less than 1 percent were enrolled in ARC-IC, and the rest were enrolled in PLC), ARC-CO is the focus of the rest of this article.
The table below presents the simulated estimates of per-acre revenues for U.S. corn, soybean, and winter wheat producers and the corresponding payments under ARC-CO, PLC, and SCO. These revenue and payment estimates are based on projected prices from USDA’s Risk Management Agency and historic yields collected from USDA’s National Agricultural Statistics Service (NASS). Prices used are from 2014 because producers made their choice between ARC and PLC after harvesting in 2014. ARC-CO alone raises expected per-acre revenue by $35, $22, and $19 for corn, soybean, and winter wheat, respectively, under 2014 projected prices.
| Category | No support | RP (75%) | ARC-CO only | SCO only | ARC+RP (75%) | RP+SCO+ PLC |
|---|---|---|---|---|---|---|
| Corn crop revenue + net payment | 664 | 687 | 699 | 677 | 721 | 710 |
| Soybean crop revenue + net payment | 498 | 517 | 520 | 507 | 538 | 533 |
| Winter wheat crop revenue + net payment | 261 | 278 | 280 | 268 | 297 | 302 |
| Note: Revenue protection that guarantees 75 percent of expected revenue is used because this coverage level is the most popular for soybeans. RP = Revenue Protection; ARC-CO = Agriculture Risk Protection-County; SCO = Supplemental Coverage Option; PLC = Price Loss Coverage. The RP payment is the net indemnity. The results are for estimates across a representative producer in each U.S. soybean-producing county, given 2014 expected prices and yields. With ARC and PLC, the results across counties are weighted by base acres, while SCO and RP are weighted by planted acres. The "SCO-only" results are for the purpose of illustration; this program is not available independently of an underlying insurance product such as RP. Source: USDA, Economic Research Service calculations, using data from USDA, National Agricultural Statistics Service; USDA, Risk Management Agency; and the Chicago Board of Trade. |
||||||
In contrast to ARC, PLC simply pays producers when the market price falls below an established price floor. Specifically, producers receive the difference between the “reference price”—this is simply a floor price—and the market price multiplied by the “program yield” (based on the farm’s historic yield) and 85 percent of base acres. If the market falls below the national loan rate, the price per unit that a producer can borrow from the Commodity Credit Corporation to hold the commodity for a later sale date, the PLC payment formula uses the national loan rate instead.
Importantly, producers enrolled in PLC cannot simultaneously be enrolled in ARC. Neither PLC nor ARC requires producers to pay premiums. Also, as stated earlier, enrollment in either PLC or ARC is a one-time decision that lasts the duration of the current Farm Act.
Choosing Between Programs – the Example of ARC-CO and PLC
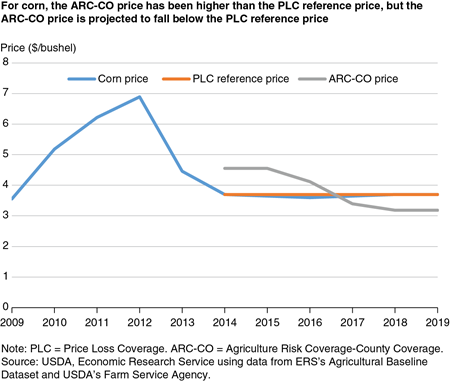
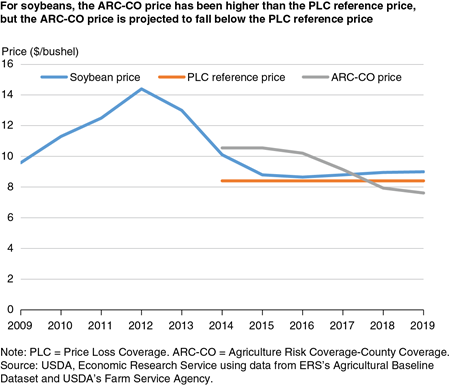
Producers selected programs based on a careful weighing of available coverage options, which were based on price and yield expectations through 2018 and on program parameters, such as the reference price.
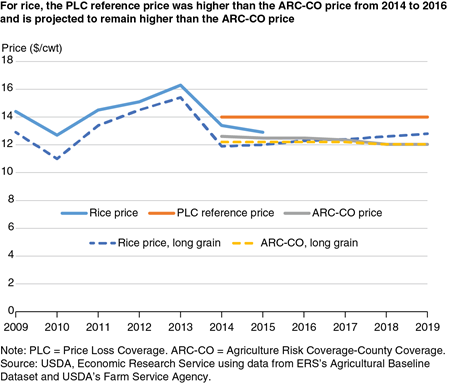
This choice can be illustrated using a comparison of USDA Baseline market price projections reported in February 2015 (those in place when producers had to choose between the two programs) and ARC-CO and PLC-specific prices for corn and soybeans. The analysis assumes the average yield used for ARC-CO remains constant and equal to the base yield for PLC. ARC-CO’s prices are higher than PLC’s reference prices for corn and soybeans in the early half (2015-17) of the Farm Act’s duration. However, over time, ARC-CO prices are pushed below the market prices, rendering the PLC prices more advantageous. For corn and soybeans, given these price projections, ARC-CO appears preferable from a price standpoint. In fact, producers have enrolled significantly more corn and soybean base acres in ARC-CO than in PLC. For rice, PLC has a significant advantage in triggering payments based on price shortfalls, and producers have enrolled many more rice base acres in PLC than in ARC-CO.
Supplemental Coverage Option (SCO)
SCO complements the coverage offered by other crop insurance policies like Yield Protection and Revenue Protection. Unlike ARC, producers must already have purchased YP, RP, or RP-HPE to buy SCO coverage, which must match the producer’s existing crop insurance policies (e.g., yield or revenue). For example, if the producer has a Revenue Protection policy, SCO payments begin when realized (county-level) revenues fall below 86 percent of expected revenues and cover up to the level of insurance (as high as 85 percent) selected by the producer for the underlying policy. As with other Federal crop insurance policies, participants in SCO also pay a premium, though 65 percent is subsidized. Participants are not allowed to enroll the same acres in both ARC and SCO.
As shown in the table, the average soybean revenue per acre rises from $498 to $533 as successive layers of programs (RP, SCO, and PLC) are added to the baseline revenue, assuming 2014 planting time prices. However, the highest revenue per acre is realized with ARC-CO and RP at 75 percent, suggesting many soybean producers would select ARC-CO over the combination of PLC and SCO.
Stacked Income Protection Plan
The 2014 Farm Act introduced the STAX program to cover upland cotton, which is not eligible for ARC or PLC. Like SCO, STAX falls under Federal crop insurance and offers the possibility of coverage on top of insurance programs like YP and RP. As a standalone insurance policy, STAX can cover losses ranging from 70 to 90 percent of expected county revenues, although the producer may select a higher lower bound or lower upper bound for coverage. For example, if a producer selects the 90-percent coverage level and actual county revenues fall to 80 percent of expected revenues, STAX issues a payment equal to the revenue difference (10 percent) times a protection factor. The protection factor is a value between 0.8 and 1.2 that is chosen by the producer. STAX does not cover losses below 70 percent of the expected revenue or the coverage of the producer’s YP or RP policy (if applicable), whichever is greater. STAX participants must pay a premium of which the Federal Government subsidizes 80 percent.
Cotton producers can choose between STAX and SCO. Using the projected price for upland cotton from the Risk Management Agency and historic yields from NASS, average revenue and payment estimates are calculated for upland cotton-producing counties. Assuming producers have RP policies with 70 percent coverage and STAX policies that trigger at 90 percent of expected county revenue and a protection factor of one, RP and STAX each contribute an average of $23 per acre of additional revenue. If the same producers were to enroll in RP with 70 percent coverage, RP again contributes an average of $23 per acre and SCO adds $14 per acre. For most farmers, STAX has exhibited higher returns than SCO. For this reason, in 2016, cotton producers purchased approximately 12,000 STAX policies (2.5 million acres enrolled) and only about 120 SCO policies (3,400 acres). Enrollment in both of these programs was much lower than the 9.4 million acres of upland cotton enrolled in Yield Protection and Revenue Protection.
| Category | No support | RP (75%) | SCO only | STAX | SCO+RP | STAX+RP |
|---|---|---|---|---|---|---|
| Net payment | N/A | 23 | 14 | 23 | 37 | 46 |
| Revenue | 499 | 522 | 513 | 522 | 536 | 545 |
| Note: Revenue Protection that guarantees 70 percent of expected revenue is used because this coverage level is the most popular for upland cotton. RP = Revenue Protection; SCO = Supplemental Coverage Option; STAX = Stacked Income Protection Plan. The results are for estimates across a representative producer in each U.S. upland producing county, given 2014 expected prices and yields. The results across counties are weighted by planted acres. The “SCO only“ results are for the purpose of illustration; this program is not available independently of an underlying insurance product such as RP. Source: USDA, Economic Research Service calculations, using data from the USDA, National Agricultural Statistics Service; USDA, Risk Management Agency; and the Chicago Board of Trade. |
||||||
Risk Management Tools for Dairy Producers
Margin Protection Program for Dairy Producers
In 2009, the U.S. dairy sector experienced extremely low milk prices and high feed costs that resulted in low profit margins for dairy farmers. In 2012, margins were again squeezed by high feed prices. In response to these economic stresses, the 2014 Farm Act terminated previously existing programs and introduced a new program, the Margin Protection Program for Dairy Producers (MPP-Dairy). In contrast to previous programs, MPP-Dairy offers dairy producers coverage options for low margins, which are measured as the difference between milk prices and feed costs.
For an administrative fee of $100 per year, the program issues payments to producers when the calculated national margin falls below $4 per hundredweight of milk. Producers seeking to widen the margin of protection (up to $8) can “buy-up” additional coverage by paying higher premiums. Each participating dairy operation may cover from 25 to 90 percent of the operation’s milk production history.
For existing dairy operations, the production history is established using the highest annual milk production marketed during the full calendar years of 2011, 2012, or 2013. Procedures are also available for new dairy operations to establish production history. MPP-Dairy has a two-tiered premium structure with higher premiums for covered historical production above 4 million pounds. Like enrollment in ARC and PLC, enrollment in MPP-Dairy lasts the duration of the 2014 Farm Act (2018). Therefore, a producer signed up for MPP-Dairy is required to pay the administrative fee—and the premium, if buy-up is purchased—every year for the duration of the 2014 Farm Act. While the buy-up option is a yearly decision, the administrative fee is required each year.
ERS findings suggest that had MPP-Dairy been in place from 2002 to 2013, small operations (those with a 4-million-pound production history) would have seen increases in average realized margins for each higher level of coverage, with the highest realized margins at $8 per cwt coverage. Larger operations (those with a production history of 20 to 40 million pounds) would have generally seen increases in average margins when protected up to the $6.50 per cwt level, with margins being maximized at $6.00 coverage. Risk reduction varies by region since milk prices and feed costs in each region do not match national milk prices or estimated national average feed costs.
Additional Programs for Managing Crop and Livestock Production Risk
In addition to the programs described here, the Federal Government offers disaster assistance to producers of crops not eligible for Federal crop insurance as well as livestock. The Non-insured Crop Disaster Assistance Program charges producers a premium and in return guarantees up to 65 percent of a crop producer’s expected yield. For livestock producers, any animal losses attributable to extreme weather or pastureland lost due to drought receive compensation from the Livestock Indemnity Program and the Livestock Forage Disaster Program, respectively. These livestock programs do not charge a premium.
Layering Programs To Mitigate Impacts of Downside Weather and Market Risks
Agricultural producers face significant uncertainties in production and prices that lead to unpredictable swings in farm returns. The 2014 Farm Act represents a shift in the direction of risk management policies, offering a variety of programs for producers. Through multiple coverage options, these programs raise producers’ revenues on average and reduce volatility. As such, the programs can be used by producers in their overall risk management strategy as potential supplements to market-based instruments for addressing farm risk.
Federal Crop Insurance Options for Upland Cotton Farmers and Their Revenue Effects, by Ashley Hungerford and Erik O'Donoghue, ERS, October 2016
The 2014 Farm Act Agriculture Risk Coverage, Price Loss Coverage, and Supplemental Coverage Option Programs' Effects on Crop Revenue, by Erik O'Donoghue, Ashley Hungerford, Joseph Cooper, Thomas Worth , and Mark Ash, USDA, Economic Research Service, January 2016
Changing Structure, Financial Risks, and Government Policy for the U.S. Dairy Industry, by James M. MacDonald, Jerry Cessna, and Roberto Mosheim, USDA, Economic Research Service, March 2016
The Effects of the Margin Protection Program for Dairy Producers, by Tyler B. Mark, Kenneth H. Burdine, Jerry Cessna, and Erik Dohlman, ERS, September 2016
Structure and Finances of U.S. Farms: Family Farm Report, 2014 Edition, by Robert A. Hoppe, USDA, Economic Research Service, December 2014
USDA Agricultural Projections to 2024, by Paul Westcott and James Hansen, USDA, Economic Research Service, February 2015
U.S. Department of Agriculture, Farm Services Agency (undated). “ARC/PLC Program, USDA, Economic Research Service
U.S. Department of Agriculture, Risk Management Agency (2016). “Federal Crop Insurance Corporation Nationwide Summary- By Insurance Plan.”, USDA, Economic Research Service