

Productivity Growth Is Still the Major Driver in Growing U.S. Agricultural Output
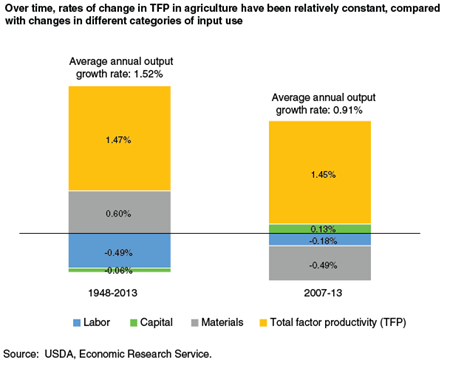
ERS has updated its U.S. agricultural productivity accounts through 2013. The revised and extended data show that while annual productivity growth dropped from 1.46 percent in 1990-2000 to 0.6 percent in 2000-07, it rebounded in recent years, rising to 1.45 percent in 2007-13. Strong productivity growth offset declining use of agricultural inputs (e.g., land, and labor) during the latter period and enabled agricultural output (production) to continue to grow at a rate of 0.91 percent per year, which is comparable to that in 2000-07.
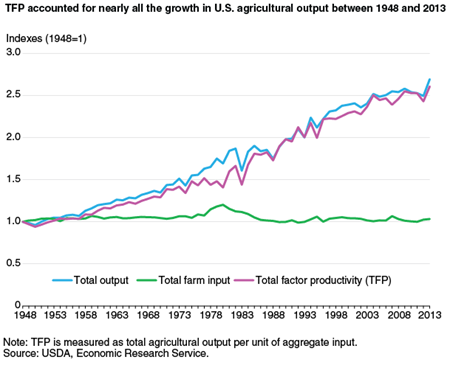
To monitor the U.S. farm sector’s performance, ERS develops total factor productivity (TFP) statistics measured as total agricultural output per unit of aggregate input, with each adjusted for price changes. Specifically, productivity growth is the difference between the growth of aggregate output and the growth of all inputs taken together. Total factor productivity, therefore, measures changes in the efficiency with which inputs are transformed into output.
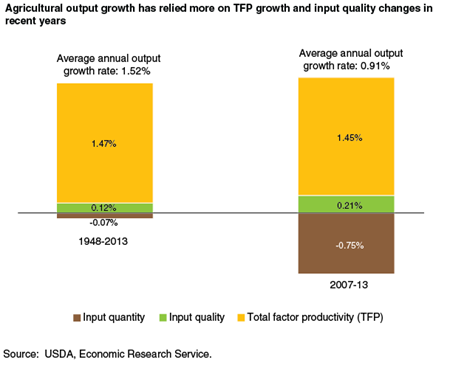
In addition to producing annual productivity indexes, ERS also reports measures of average annual growth rates of agricultural output, inputs, and TFP for the period 1948 through 2013 and in subperiods defined by business cycles (measured from peak to peak, in accordance with fluctuations in the overall U.S. economy). Estimates for longer timespans are useful for identifying trends in productivity growth—averaging out short-term deviations—and for identifying the sources of output growth. Between 1948 and 2013, agricultural output grew at an average annual rate of 1.52 percent. With total input use growing at only 0.05 percent per year on average, TFP growth accounted for almost all output growth during the period. At an average annual rate of 1.47 percent, agricultural TFP growth exceeded productivity growth in most U.S. industries, as reported by the U.S. Department of Labor’s Bureau of Labor Statistics.
The major driver of longrun productivity growth in agriculture is technology advancement. However, in the short term, productivity growth can be affected by unfavorable weather or other transitory effects. For example, even though use of agricultural inputs increased by about 2.5 percent in 2012, output fell by 1.4 percent that year due to the severe and extensive drought in the U.S. Consequently, TFP fell by about 4.0 percent in 2012. In 2013, output rebounded, growing by 7.7 percent. And with minor growth in input use that year, TFP grew by 7.0 percent.
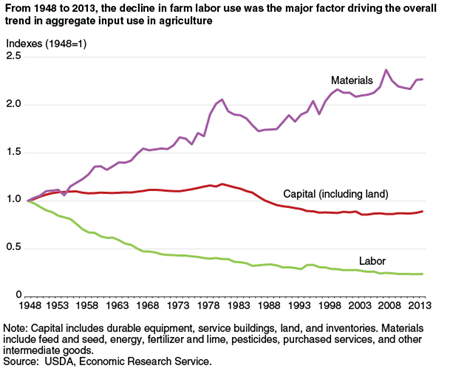
While the aggregate index of inputs grew little over the past 65 years, the composition of inputs changed markedly, shifting away from labor and land and toward machinery and intermediate goods (including energy, agricultural chemicals, purchased services, and other materials). Between 1948 and 2013, input use decreased for labor and land (down by 76 percent and 26 percent, respectively) and increased for materials, durable equipment, and service buildings (up by 127 percent, 89 percent, and 13 percent, respectively).
ERS also examines the sources of agricultural output growth—apportioning increases in output among changes in TFP, input quantities, and input quality. Changes in input quality reflect changes in the composition of input classes within the broad categories of labor, capital, and materials. For example, educational attainment has grown over the years in agriculture as it has in the overall economy, so that farm operators are more likely to have some college or a college degree today than in 1950, and hired farmworkers are more likely to have a high school diploma today than in 1950. Higher educational attainment can raise workers’ productivity by enhancing their skills and ability to learn and adapt to new technologies. The nutrient composition of fertilizers and the physical characteristics of pesticides—such as toxicity, persistence in the environment, and leaching potential—have also changed over time, altering the quality of agricultural chemicals. The USDA measure of aggregate input growth accounts for changes not only among but also within the broadly defined categories of labor, capital, and materials, as well as in attributes of inputs. Aggregate input growth is decomposed into changes in unweighted stocks (such as hours of labor) and input quality components (labor adjusted for changes in education and other productivity-enhancing attributes).
| Source | 1990-2000 | 2000-2007 | 2007-2013 | 1948-2013 |
|---|---|---|---|---|
| Output growth | 1.89 | 0.92 | 0.91 | 1.52 |
| Sources of growth | ||||
|
Labor
|
-0.21 | -0.40 | -0.18 | -0.49 |
|
Capital
|
-0.20 | -0.06 | 0.13 | -0.06 |
|
Materials
|
0.84 | 0.78 | -0.49 | 0.60 |
|
TFP
|
1.46 | 0.60 | 1.45 | 1.47 |
| Source decomposition | ||||
| Labor | ||||
|
Hours
|
-0.41 | -0.45 | -0.24 | -0.61 |
|
Quality
|
0.19 | 0.05 | 0.07 | 0.12 |
| Capital | ||||
|
Stocks
|
-0.09 | -0.12 | -0.07 | -0.08 |
|
Quality
|
-0.11 | 0.06 | 0.20 | 0.02 |
| Materials | ||||
|
Quantity
|
0.84 | 0.79 | -0.44 | 0.62 |
|
Quality
|
0.00 | -0.01 | -0.05 | -0.02 |
| TFP = total factor productivity. Source: USDA, Economic Research Service. |
||||
Each major input component—labor, capital, and intermediate goods—contributed to output growth distinctly. According to ERS’s productivity accounts, the persistent contraction in labor input contributed negatively to output growth over the entire 65-year period. However, in recent years (2007-13), this effect has lessened due to slowing in the decline of farm labor use. Between 1948 and 2013, improved labor quality through educational attainment contributed positively to output growth at 0.12 percentage points a year, offsetting part of the negative impact of labor quantity contraction. With the slower growth rate of farmworkers’ educational attainment in more recent years, the contribution of labor quality improvement to output growth has become smaller. Capital quality change due to composition shifts within the capital input category is another source of output growth; in 2007-13, this effect contributed 0.2 percentage points per year, or about 25 percent of output growth, which is higher than the average for the entire analysis period. While rapid growth in materials use has played an important role in output growth in earlier years, its effect has declined in recent years (2007-13). However, despite these changes in input trends, TFP has accounted for most agricultural output growth over both the long run and the most recent subperiod.
Agricultural Productivity in the U.S., by Sun Ling Wang, Eric Njuki, Richard Nehring, and Roberto Mosheim, USDA, Economic Research Service, January 2024
Agricultural Productivity Growth in the United States: Measurement, Trends, and Drivers, by Sun Ling Wang, Paul Heisey, David Schimmelpfennig, and Eldon Ball, USDA, Economic Research Service, July 2015
Productivity and Economic Growth in U.S. Agriculture: A New Look, by Eldon Ball, Sun Ling Wang, Richard Nehring, and Roberto Mosheim, Applied Economic Perspectives and Policy, January 2016, Volume 38, Number 1, pp. 30–49