

Investigating Temporal Effects on Measured SNAP Participation Rates

USDA’s Supplemental Nutrition Assistance Program (SNAP) provides monthly benefits for purchasing foods at authorized food stores to families who meet income and other eligibility criteria. In an average month of fiscal year 2015, 45.8 million people participated in SNAP. However, not all eligible households apply for SNAP. Some people may not realize they are eligible; others may not want assistance; and others may believe their economic situation will improve in the near future.
The SNAP participation rate—the share of eligible individuals who choose to participate in SNAP—will differ depending on the timeframe used to measure eligibility and participation. USDA calculates the official SNAP participation rate for an average month in a year. Yet, most Federal survey data that measure SNAP participation are based on an annual timeframe. For example, respondents are asked whether they participated in SNAP at any time during the year by the Current Population Survey and the American Community Survey. ERS analysis found that the SNAP participation rate is lower when measured annually, or “at some time during the year,” than if it is measured for an “average month.” More individuals are eligible at some time during the year than in an average month. And more individuals participate at some time during the year than in an average month, but the higher number of annual participants (compared with average-month participants) is not as big as the higher number of annually eligible individuals.
The underlying behavioral explanation for the difference in the two rates is that individuals who are eligible for more months of assistance are more likely to participate than those eligible for just a few months. Statistically, in USDA’s average-month participation rate, those people who are eligible for more months of the year get more weight (compared to those who are eligible for just a few months), and their relatively higher participation rate pulls the average-month rate above the annual rate.
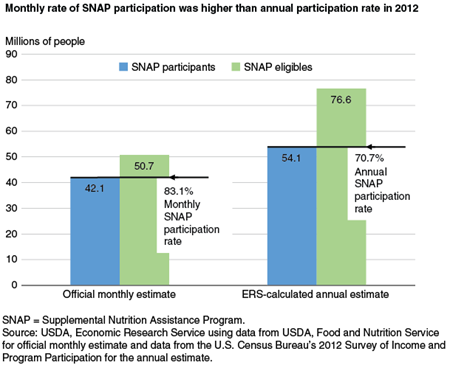
A recent ERS study confirms this relationship between monthly and annual SNAP participation rates. ERS researchers estimated the annual rate using data on SNAP participation, household income, and other eligibility-related variables from the U.S. Census Bureau’s 2012 Survey of Income and Program Participation. While the official average-month SNAP participation rate was 83.1 percent in 2012, ERS estimates show the annual SNAP participation rate to be 70.7 percent for that year. It is important for researchers and policymakers who use annual survey data to analyze SNAP trends to be aware of these temporal effects on measured SNAP participation rates.
Annual and Monthly SNAP Participation Rates, by Mark Prell, Constance Newman, and Erik Scherpf, USDA, Economic Research Service, August 2015