

Updated ERS County Economic Types Show a Changing Rural Landscape

The updated ERS county economic typology codes show that the number of farming-dependent counties fell moderately while manufacturing-dependent counties had a sharp decline between 2001 and 2010-12 (the most recent farm dependency codes are based on a 3-year weighted average of farm income and employment). Among the county economic types that grew, mining-dependent counties had the largest increase, while Federal-State dependent and recreation counties showed a slight increase.
The ERS county economic typology codes are a classification system for researchers and policy analysts that provide a tool to analyze and characterize the economic base of U.S. counties. These economic typologies are a part of a larger set of county classifications that include additional indicators of policy-relevant themes, such as counties with low employment and persistent poverty.
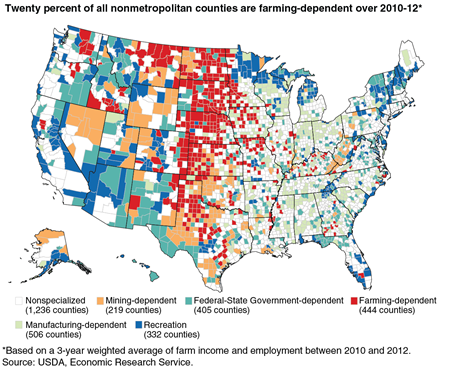
ERS first released the county economic typology codes in 1986, and the codes are updated roughly every 10 years. These codes determine the county type based primarily on nonmetropolitan income and earnings in the sector (see box, 'How the County Economic Types Were Constructed'). While designed primarily to facilitate analysis of changes in nonmetropolitan counties, codes for metropolitan counties have been included to facilitate comparisons across the country since 2004. The latest typology codes show the regional concentration of the economic types. Farming-dependent counties are concentrated in the Great Plains, manufacturing-dependent counties are found more often in the Rust Belt and Southern Piedmont, while Federal-State Government-dependent counties are clustered in the West.
The county economic types are not directly comparable to previous versions because of changes in the way industries are classified, availability of data, and different qualifying criteria. However, comparisons can be made by recomputing the typology codes for 2001 using the same criteria and data sources used in the 2010-12 codes, together with income and employment data for 2001 and housing data from 2000. This procedure allows researchers to make some basic generalizations about how changes in economic conditions affected the distribution of counties between 2001 and 2010-12.
Farming-dependent counties
Despite record net farm income from 2011-13, the total number of farming-dependent counties fell from 511 in 2001 to 444 in 2010-12, continuing its long-term decline. Most farming-dependent counties are nonmetropolitan counties, and the number of nonmetropolitan farming counties fell from 444 to 391 during the same period. Of the 53 metropolitan farming counties, 52 of them are outlying counties of metropolitan areas. Outlying counties are primarily rural but are part of a metropolitan area because of high commuting flows with adjacent metropolitan counties.
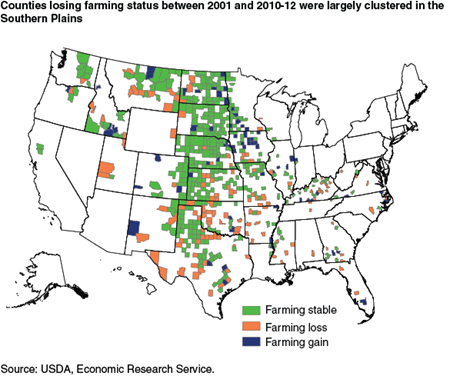
Farming is still a principal source of income and employment in many counties; however, farm consolidation, increasing productivity, and labor-saving technology has led to a significant decline in farm employment. Nationally, the number of farm jobs fell by 14.1 percent between 2001 and 2013. During the same period, total farm earnings increased 63.4 percent (in real terms), according to data from the Bureau of Economic Analysis. Farming dependence has become more concentrated in Midwestern counties, while farm dependence has dropped more sharply elsewhere.
Mining-dependent counties
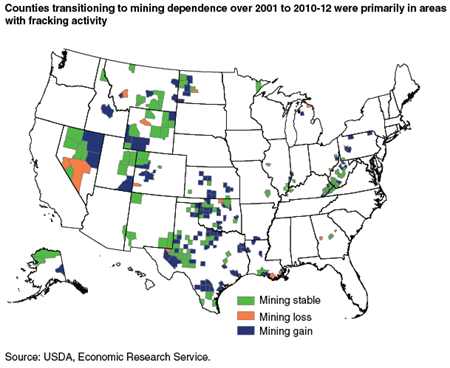
The number of mining-dependent counties increased from 130 to 219 between 2001 and 2010-12. The increase in the number of mining-dependent counties is directly related to oil and gas extraction. Hydraulic fracturing (fracking) and horizontal drilling methods have opened up many counties to the extraction of their oil and gas resources. The new mining-dependent counties are most evident in the northwestern part of North Dakota, western Texas, and Pennsylvania. Of the 219 mining counties, 183 are nonmetropolitan counties.
Manufacturing-dependent counties
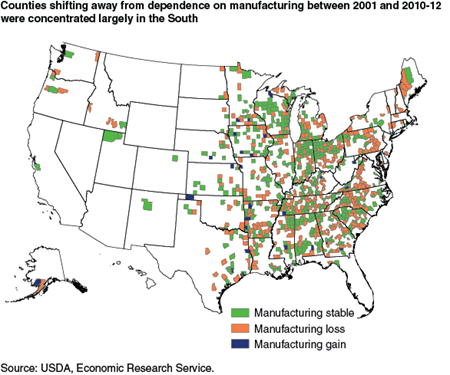
Manufacturing had traditionally been the dominant sector in many metropolitan and nonmetropolitan counties. The number of manufacturing counties fell by over 40 percent from 882 counties in 2001 to 506 in 2010-12. The recession of 2007-09, outsourcing production to foreign counties, competition from abroad, and the high value of the dollar have all led to job losses in manufacturing counties. Manufacturing-dependent counties tend to be concentrated in the East North Central States and the South and are primarily nonmetropolitan.
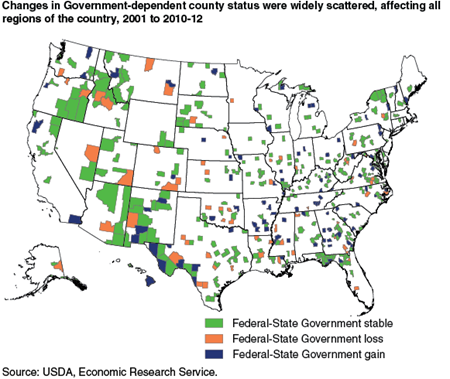
Federal and State Government-dependent counties
Government-dependent counties are based on the employment and earnings in the Federal civilian and State government sectors. The number of Federal and State Government-dependent counties has increased from 368 in 2001 to 405 counties in 2010-12. These counties can be found scattered throughout the Nation, often reflecting geographic factors rather than economic conditions. The largest concentrations are found around Federal parks and forests, military bases, State capitols, State educational institutions, and prisons.
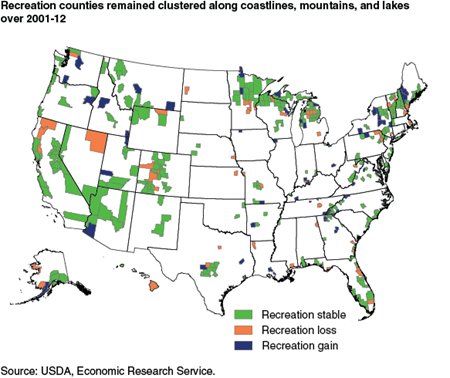
Recreation counties
Recreational activities have long been the driving economic force behind many nonmetropolitan communities. Counties near national or State parks, rich in natural amenities, or those that have other recreational attractions have often been the fastest growing nonmetropolitan counties. Between 2001 and 2013, employment growth in recreation counties was second only to growth in mining counties. The economic base of these counties is highly dependent on recreational activities and associated businesses. Recreational dependence was determined by several measures—the share of county employment and income related to recreation and associated businesses, and the share of housing units intended for occasional use only. Most recreation counties found in the Upper Great Lakes region, the Mountain West, upstate New York, and New England are primarily nonmetropolitan counties.
| Nonmetro 2001 | Nonmetro 2012 | Metro 2001 | Metro 2012 | Total 2001 | Total 2012 | |
|---|---|---|---|---|---|---|
| Farming-dependent | 444 | 391 | 67 | 53 | 511 | 444 |
| Mining-dependent | 113 | 183 | 17 | 36 | 130 | 219 |
| Manufacturing-dependent | 571 | 351 | 311 | 155 | 882 | 506 |
| Federal-State Government-dependent | 218 | 238 | 150 | 167 | 368 | 405 |
| Recreation | 217 | 228 | 108 | 104 | 325 | 332 |
| Nonspecialized | 411 | 585 | 513 | 651 | 924 | 1,236 |
| Total | 1,974 | 1,976 | 1,166 | 1,166 | 3,140 | 3,142 |
| *The same criteria used in 2010-12 were used for the 2001 data to determine the types. Counties that are not dependent on farming, mining, manufacturing, Federal-State Government or recreation are termed "nonspecialized." Note: Metro and nonmetro counties are based on the 2013 Office of Management & Budget definition. Source: USDA, Economic Research Service. |
||||||
Errata: On June 5, 2017, the map titled, “Twenty percent of all nonmetropolitan counties are farming-dependent over 2010-12*” was reposted to correct a misclassification of six counties.
<a name='sidebar1'>How the County Economic Types Were Constructed</a>
The farming-, mining-, manufacturing-, and Government-dependent county types were identified using the Bureau of Economic Analysis (BEA) Local Area Annual Personal Income and Employment county-level data files. Labor and proprietor income and employment by place of work for the industry sectors were analyzed and the nonmetropolitan means and standard deviations were computed for 2010-12. A weighted mean was computed for the 3 years of data. The thresholds for these county types were roughly set at the nonmetropolitan mean plus one standard deviation for both earnings and employment. Recreation counties were identified using BEA employment and income data, as well as seasonal housing vacancy data from the Decennial Census of Population.
Recreation counties were identified by calculating the percentage employed; the percentage of total earnings in entertainment, recreation, accommodations, eating and drinking places, and real estate; and the percentage of vacant housing units intended for seasonal or occasional use reported in the 2010 Census of Population. The three variables measuring employment, earnings, income, and seasonal housing were converted to a weighted index, and counties scoring at least two-thirds of a standard deviation above the mean were considered to be recreation counties.
If a county qualified for more than one economic type, it was coded to the type that accounted for the highest percentage of earnings. Counties that did not qualify for any economic types were classified as nonspecialized.
County Typology Codes, by John Pender, USDA, Economic Research Service, October 2019
Documentation, by John Pender, USDA, Economic Research Service, October 2019