

Inflation and Higher Food Prices Kept Food Insecurity Rates Relatively High After the 2007-09 Recession
Highlights:
-
U.S. food insecurity increased from 11.1 percent in 2007 to 14.6 percent in 2008 with the onset of the Great Recession and has remained high.
-
Falling unemployment rates from early post-recession (2009-10) to 2013, absent any other changes, would have reduced the prevalence of food insecurity by a little more than a percentage point.
-
However, potential decreases in food insecurity were offset by pressure on low-income families’ food budgets from higher inflation and higher food prices.
In 2013, 17.5 million U.S. households (14.3 percent) were food insecure at some time during the year; that is, they were, at times, unable to acquire adequate food for one or more household members because they had insufficient money and other resources for food. During most of the period since USDA began monitoring food security in 1995, the rate of food insecurity had remained between 10 and 12 percent, including the 2001 recession. However, with the onset of the Great Recession in December 2007, food insecurity increased from 11.1 percent in 2007 to 14.6 percent in 2008.
Food insecurity has remained near that level since, despite a decline in unemployment from its peak of 10 percent in October 2009 to 6.7 percent in December 2013. While 2013’s prevalence of food insecurity was lower than 2011’s prevalence of 14.9 percent, food insecurity rates remain above pre-Great Recession levels. This leads to the questions, “Why has food security not improved along with unemployment?” and “What other economic conditions might be at play?”
What We Know About the Determinants of Food Insecurity
Research provides considerable insight into the household-level factors that affect food insecurity. In addition to other factors, earning low wages, being a single parent, or having a household member with a disability make a household more likely to be food insecure. However, less is known about how the overall economy influences food insecurity at a national level. Recently, ERS researchers developed a model of macroeconomic factors to predict the prevalence of food security. Three major factors were found to be important: the highest monthly national unemployment rate in the calendar year, the general inflation level of U.S. goods and services, and the price of food relative to other goods and services. Unemployment, inflation, and food price levels all put pressure on the spending power of low-income households, either through disrupting the flow of income (through unemployment) or by making incomes worth less (through inflation or rising food prices).
The initial ERS model was developed using 2001-12 household survey data from the Current Population Survey Food Security Supplement and economic indicators from the U.S. Bureau of Labor Statistics (unemployment rate, Consumer Price Index (CPI) for all goods and services, and CPI for food). For this article, researchers used the estimated associations between food insecurity prevalence and the national economic indicators from the analysis of 2001-12 data and 2013 economic indicators to predict and explain changes in the 2013 food insecurity rate.
Improvements in Unemployment Alone Would Have Lowered Food Insecurity Rates…
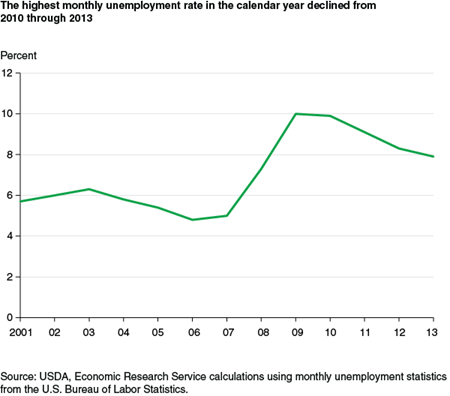
The national unemployment rate is an indicator of the general health of the economy. A low or declining unemployment rate is associated with relatively low food insecurity because it signals overall economic health as well as robust, or increasing, demand for workers. Robust demand for workers usually translates into more available jobs and higher wages. Thus, by itself, a decline in unemployment is expected to lead to a decline in food insecurity.
The highest monthly unemployment rate dropped from 10.0 percent in 2009 to 7.9 percent in 2013. Unemployment is measured here as the highest monthly unemployment rate during the calendar year, rather than the average annual unemployment rate, because it reflects the worst economic conditions during the year. Food insecurity also reflects the worst economic conditions during the year, as each question in the food security measure asks whether the condition or behavior ever occurred “in the past 12 months.” According to the estimates from the ERS model, the change in unemployment between the early post-recessionary period (2009-10) and 2013 would have resulted in a reduction in the food insecurity rate of 1.07 percentage points had nothing else changed.
… But Inflation and Higher Food Prices Took Their Toll
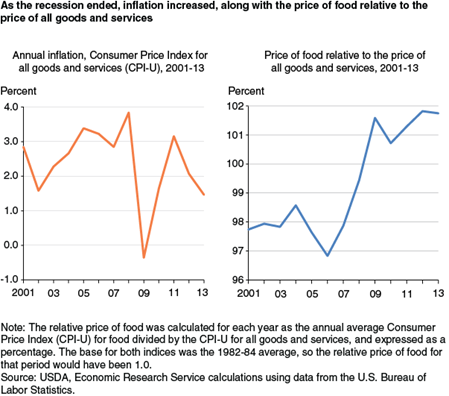
However, as unemployment declined, inflation and the cost of food increased. With increases in inflation, households must stretch their incomes further to purchase essential goods such as food, clothing, transportation, and rent or mortgage payments. Inflation may put a strain on household resources, particularly if incomes do not increase at the same rate as prices. Along with increases in general inflation from 2009 to 2013, the price of food relative to other goods and services also increased, straining low-income households’ budgets since food is an essential part of a household’s consumption.
Households facing food insecurity may be unable to spend a greater share of their household budgets on food when food prices increase, especially if general inflation has risen as well. The rate of inflation was higher in 2010 following a decline in 2009, and peaked in 2011; the rate of inflation was lower again in 2012 and 2013. The price of food relative to the price of all goods and services increased steadily from 2010 to 2012 before leveling off in 2013. Based on increases in food prices and overall inflation, the researchers’ model predicted that food insecurity should have gone up by 0.74 percentage points from 2009-10 to 2013.
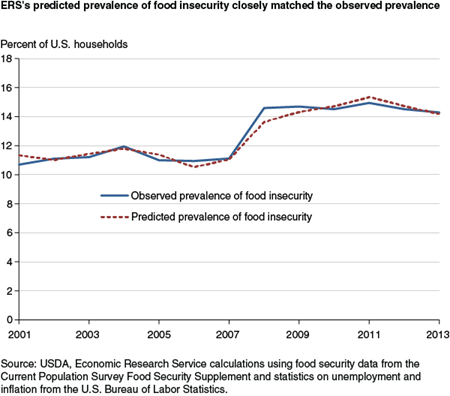
Taken together, inflation and the higher relative cost of food moderated the effect of lower unemployment so that food insecurity was relatively stable from the end of the Great Recession through 2013. While improvements in food insecurity may have been expected given declining unemployment, those gains were offset by increasing overall prices and increasing food prices in particular. Changes in the unemployment rate and relative price of food accounted for more of the year-to-year change in food insecurity than the change in inflation. Based on the researchers’ model, the predicted prevalence of food insecurity in 2013 was 14.2 percent, very near the observed prevalence of 14.3 percent. On average, the actual food insecurity rate differed from the rate predicted by the model by about a third of a percentage point over 2001 to 2012.
The model developed by ERS researchers allows one to look at how hypothetical future changes to unemployment, inflation, and relative food prices might affect the prevalence of food insecurity. If these national economic conditions were to revert from 2013 levels back to pre-recession levels, what might happen to the national food insecurity rate? The associations estimated in the study can be used to quantify the possible impact on food insecurity. For example, if the highest monthly unemployment rate were to return to the 5.07 percent average level of 2005-07 from the 2013 rate, absent any other changes, food insecurity is estimated to fall to 12.8 percent. While a decline relative to the current food insecurity rate, it is still above the 11.1 percent prevalence of food insecurity in 2007, before the effects of the recession set in. This highlights the importance of inflation and food prices in determining food insecurity. If highest monthly unemployment and annual inflation remained at 2013 levels but the relative price of food were to fall from the 2013 level to the 2005-07 average level, model results predict that food insecurity would fall to 11.8 percent—still above the 2007 food insecurity rate, but below what might occur if only unemployment changed.
Implications for the SNAP Program and Its Participants
These findings help inform our understanding of how USDA’s Supplemental Nutrition Assistance Program (SNAP) affects household food security. SNAP benefits are adjusted for inflation in October of each year, based on food-price data from June of that year. By the following September, food prices may have increased. If the food buying power of SNAP benefits has declined over the benefit year, SNAP households would have a reduced ability to acquire adequate food, and the ability of the program to improve nutrition and food security would be lessened.
Another recent ERS study also provides evidence that the real (inflation-adjusted) value of SNAP benefits is important to household food security. In 2009, the maximum SNAP allotment was temporarily increased as part of the American Recovery and Reinvestment Act. From April 2009 to November 2013, SNAP allotments were held constant and not adjusted for increases in inflation. As a result, the real value of SNAP benefits declined over that time. The ERS study found that from 2009 to 2011, when average real SNAP benefits declined by about 7 percent, food security worsened for SNAP recipient households, but not for low-income households not participating in the program.
As the real value of SNAP benefits declined, the percentage of SNAP-recipient households with very low food security increased from 12.1 percent in 2009 to 13.8 percent in 2011. Very low food security is the severe range of food insecurity in which the food intake of some household members is reduced and normal eating patterns are disrupted. Food spending by SNAP-recipient households declined as well over this period. Low-income non-SNAP recipient households—households that were not affected by the declining real value of SNAP benefits—did not experience any significant changes in food security or food spending.
These studies together suggest that SNAP households are sensitive to changes in the value of their SNAP benefits relative to increases in food prices. As households are less able to stretch their SNAP benefits to cover increasingly costly food necessities, the program becomes less effective at improving food security.
Prevalence of U.S. Food Insecurity Is Related to Changes in Unemployment, Inflation, and the Price of Food, by Mark Nord, Alisha Coleman-Jensen, and Christian A. Gregory, USDA, Economic Research Service, June 2014
Household Food Security in the United States in 2013, by Alisha Coleman-Jensen, Christian A. Gregory, and Anita Singh, USDA, Economic Research Service, September 2014
Effects of the Decline in the Real Value of SNAP Benefits From 2009 to 2011, by Mark Nord, USDA, Economic Research Service, August 2013