

The Revised ERS Farm Typology: Classifying U.S. Farms To Reflect Today's Agriculture
The USDA definition of a farm covers a broad range of places--from farms with no sales to multimillion dollar enterprises--and statistics portraying the characteristics of the “average farm” are not representative of most farms. ERS originally developed its farm typology in 1998 to group individual farms into more homogeneous categories for which average characteristics might be more meaningful.
Since the release of the farm typology nearly 15 years ago, the U.S. agricultural sector has changed in a number of ways. ERS recently updated the typology to reflect three important trends: commodity price increases, a shift in production to larger farms, and the rapid growth of the use of production contracts among livestock producers (see box, “Revised ERS Farm Typology”).
Commodity Price Increases
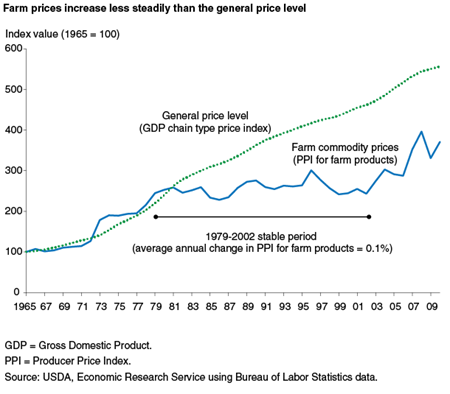
Farm commodity prices increased 41 percent between 1995--the year of the data used to establish the original typology--and 2010. Inflation-driven increases in farm size (as measured by annual sales) do not reflect changes in physical production, and if they are matched by price increases in farm inputs, they may not reflect any real improvement in the farm operator’s standard of living. To compensate for these commodity price increases, ERS increased the original $250,000 small-farm cutoff in the typology to $350,000. The new $350,000 cutoff represents the same physical production generating $250,000 of sales in 1995 but valued using 2010 prices.
The previous and revised typologies each classify small farms into four groups: retirement, off-farm occupation (previously referred to as residential/lifestyle), and farming-occupation low- and moderate-sales. In the revised typology, the threshold between small farms and larger farms was raised as noted above, and the cutoff between low- and moderate-sales farming-occupation farms was raised from $100,000 to $150,000, also to reflect commodity price increases.
Upward Shift in Production
The previous version of the typology included large farms, with sales between $250,000 and $499,999, and very large family farms, with sales of $500,000 or more. However, farm production is shifting to much larger farms. In response to the shift in the scale of production, ERS now uses a midsize category for family farms with sales between $350,000 and $999,999 and two groups for larger family farms: large (sales of $1,000,000 to $4,999,999) and very large (sales of $5,000,000 or more). The definition of nonfamily farms did not change in the updated typology.
Using GCFI Reflects Production Contracts
The original typology measured farm size by gross farm sales; the revised typology uses gross cash farm income (GCFI) to better reflect revenues received by the farm business that it can spend as necessary. GCFI includes the farm’s sales of crops and livestock, receipts of Government payments, and other farm-related income. Gross farm sales, in contrast, exclude other farm-related income and include items than are not revenue to the farm: the value of sales accruing to share-landlords and production contractors and Government payments accruing to landlords.
| Item | Gross farm sales | GCFI |
|---|---|---|
| Revenue to the farm from: | ||
| Crop and livestock sales | Yes | Yes |
| Government payments | Yes | Yes |
| Other farm-related income1 | No | Yes |
| Value of production accruing to: | ||
| Share landlords | Yes | No |
| Contractors | Yes | No |
| Landlord receipt of: | ||
| Government payments | Yes | No |
| 1Receipts from custom work, machine hire, livestock grazing fees, timber sales, outdoor recreation, production contract fees, et cetera. Source: USDA, Economic Research Service. |
||
The change to GCFI primarily affects farms growing hogs or poultry under a production contract. A contract broiler operation producing birds worth $1 million would be classified as a large farm using gross sales but as a small farm using the $110,000 in GFCI, it typically would receive as production contract fees. Contract growers provide--and are paid for--housing, labor, and utilities, but feed, veterinary services, and chicks--which account for high proportions of the total costs of production--are provided by contractors.
Farm Structure Under the Revised Typology
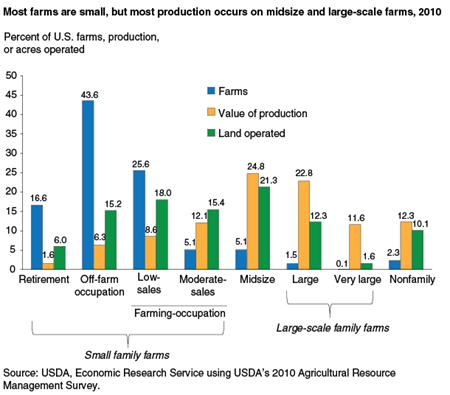
Three features stand out in the data on farms. First, small family farms make up 91 percent of all U.S. farms and operate on 55 percent of all U.S. farmland. Second, production is concentrated among midsize (25 percent) and larger family farms (34 percent), although these farms make up only 7 percent of all farms. Third, farming is still an industry of family businesses. Ninety-eight percent of farms are family farms, and they account for 88 percent of production.
Under the revised typology, the small farm share of U.S. farm production is 29 percent, compared with 16 percent in the old typology. About 5 percentage points of this increase results from changing the small-farm cutoff from $250,000 to $350,000; another 8 percentage points results from switching from gross farm sales to GCFI as the measure of farm size.
The share of farms classified as small increases modestly when changing from the old typology to the revised typology, from 88 percent to 91 percent. Thus, relatively few farms shift to the small farm categories under the revised typology, but they bring a substantial amount of production with them.
Production is likely to continue to shift to larger farms over time as long as larger farms are more profitable than smaller farms. This change has important implications for the structure of the agricultural sector. The revised ERS farm typology enables users to focus on this structural shift by adding categories at the upper end of the size distribution while removing some of the statistical “noise” introduced by changes in farm prices.

Updating the ERS Farm Typology, by Robert A. Hoppe and James M. MacDonald, USDA, Economic Research Service, April 2013