

Farm Poverty Lowest in U.S. History
Poverty on America's farms has been an economic reality for most of the country's history. Fifty years ago, half of all farm families were poor. The images of impoverished farmers living through the Dust Bowl of the 1930s remain fixed in the minds of Americans. The New Deal, which was the genesis of many USDA programs, addressed the Nation's concerns for this vulnerable population, which, back then, relied largely on farming for its livelihood. Thus, safety net programs that linked payments to commodity production were a logical means of reducing farm poverty at that time.
Today, however, farm poverty is at its lowest level in the Nation's history, thanks to the availability of remunerative off-farm employment coupled with onfarm gains in labor productivity. The well-being of farm families, who are fewer in number than in the 1930s, has improved significantly and depends much less on the outcome of the farm business.
Still, some farmers remain poor—exactly how many depends on how poverty is defined. One estimate puts the least well-off farm households at 14 percent of the 2.1 million American farm households, while another categorizes 5 percent of farm households as having low incomes and low wealth. But, because modern farm households derive their income from many nonfarm sources, traditional farm programs are not as relevant to farm households' well-being as they were in the 1930s. Instead, general safety net programs, such as food stamps or Medicaid, may be the more appropriate policy prescription, though farm household participation in such programs is typically lower than that of the general population. Closer examination of the statistical and demographic dimensions of farm poverty points to the questions that must be answered in order to devise a 21st-century approach to helping poorer farmers.
Who Is Poor?
Characterizing the well-being of households through the use of economic statistics is complicated and often controversial. The Federal definition of who is poor has remained essentially unchanged since the 1960s, except for adjustments for inflation, and is subject to many criticisms about its ability to portray accurately the numbers and characteristics of Americans with low incomes. Eligibility criteria for Federal assistance programs for those with low incomes vary with respect to income thresholds and asset limits, implying multiple views of the level of deprivation that merits Federal intervention. Similarly, no one statistical measure can capture all dimensions of a farm household's financial well-being. Three concepts can be used to categorize low-income farm households: the Census Bureau's poverty line, USDA's definition of limited-resource farmers, and ERS's definition of low-income/low-wealth farmers.
| Concept | Source | Definition | Farm poverty: percent |
Farm poverty: number of farm households |
|---|---|---|---|---|
| Poverty line | Census Bureau | Annual household income less than $18,660 for a family of four (two adults, two children) | 14 percent | 289,000 farm households |
| Limited-resource farmer | USDA | Direct or indirect gross farm sales not more than $106,400 in each of the previous 2 years, andTotal household income at or below the Census Bureau national poverty line for a family of four or less than 50 percent of county median household income in each of the 2 previous years | 11 percent | 230,000 farm households |
| Low-income/ low-wealth farmer | ERS | Annual income and wealth below median levels for U.S. households, about $44,000 and $90,000, respectively | 5 percent | 103,000 farm households |
| Note: Definitions applied to farm and household data from USDA's 2003 Agricultural Resource Management Survey. Source: USDA, Economic Research Service. |
||||
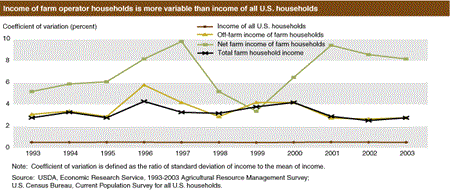
The Census Bureau's poverty definition is meant to represent income sufficient for a family to meet basic needs for food, shelter, clothing, and other essential goods and services. A household is defined as poor with respect to its income in the previous year. In 2003, 11 percent of all U.S. households had incomes below the poverty line. When applied to farm households, however, the Census Bureau's definition may produce misleading results because farm business revenue is highly volatile. Even the largest of farms may sustain losses in one year that pull down household income significantly. Still, revenue may rebound the next year, and family living standards would have been maintained in the interim by borrowing against or liquidating assets.
The Census Bureau's definition does not reference assets or net worth, which is, in any case, very low for poor nonfarm households. In general, farm households have higher asset holdings than nonfarm households because of the value of the farmland they own. The Census Bureau's definition of poverty does not vary by region or (any longer) by farm versus nonfarm household, although it does vary by family composition and, for one- and two-person households, by whether someone in the household is over age 65.
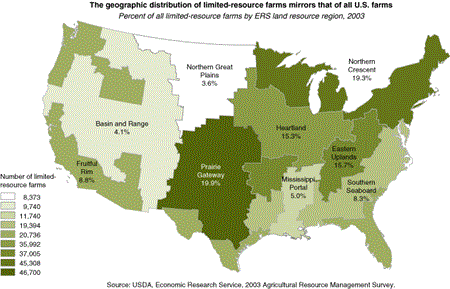
Under USDA's definition, limited-resource farmers may report farming, a nonfarm occupation, or retirement as their major occupation, but their households share the characteristics of low incomes and relatively small sales of agricultural products. The requirement for 2 sequential years of low household income helps address the volatility of farm business earnings. The definition does not specify any limit on the value of assets. Limited-resource farms are distributed broadly throughout the United States.
The ERS categorization of farm households as low-income/low-wealth recognizes that the exclusion of assets in characterizing the well-being of farm households is problematic. For farm households, land and other assets represent wealth that may be tapped to maintain living standards (albeit not indefinitely). Average farm household wealth, or net worth, in 2003 was $664,000. By comparison, the median net worth for all U.S. households was $90,000 in 2003, according to the Federal Reserve. Because of the transitory effects of farm revenue volatility, farm households that experience low incomes in 1 year still often have significant wealth.
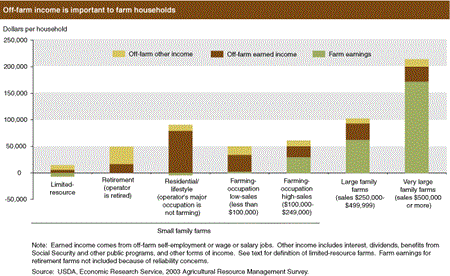
Accounting for asset holdings can present a more complete picture of the resources available to a household in making ends meet. On average, low-income/low-wealth households had annual incomes in 2003 of about $18,000 and net worth of $31,000. (See 'Composite Measure of Economic Well-Being' in this issue of Amber Waves for another interpretation of farm household well-being.) The level of household income aside, the contribution of farm earnings to poor families' incomes is modest, as it is for farm households generally. Off-farm sources account for 90 percent of aggregate farm household income. For many poor farmers, farm income is negative. As an example, in 2003, almost 60 percent of all limited-resource households with positive household income had a loss from farming.
Demographics Vary by Poverty Definition
Farm households in the Census Bureau poverty, limited-resource, and low-income/low-wealth categories are thus seen to be, to varying degrees, less well-off financially than their neighbors. However, the demographic characteristics of these households vary somewhat with the definition of poverty used.
Age. Farm households living in poverty as defined by the Census Bureau include those who operate larger farms and have substantial wealth but whose income has temporarily fallen to a low level. Consequently, the age profile of these households looks quite a bit like that for all U.S. farms, with about half of all household heads (the farm operators) between the ages of 35 and 54. Moving to the limited-resource households, with the requirement for small sales and 2 years of low income, gives a picture of an older group, with 55 percent over age 65 (versus about a quarter of all farm operators).
Adding the asset limits that are part of the low-income/low-wealth definition yields a much younger set of farm operators, almost half of whom are younger than 35. This is perhaps to be expected, as older households have accumulated assets over the course of their lives, and these assets can be drawn upon to generate living expenses. Younger families have fewer assets to draw on to buffer income swings.
Education. Limited-resource and low-income/low-wealth farm operators are less likely to have education beyond the high school level compared with either the larger group of farm operators with incomes below the Census Bureau poverty line or all farm operators. Eighty percent of limited-resource farmers and 70 percent of low-income/low-wealth farmers have high school educations or less. For all farm operators, the portion is 55 percent (and 66 percent for farm operators in households below the official poverty line).
Race/Ethnicity. More than 85 percent of the least well-off farm households are White. This result is consistent with the fact that in 2003, 91.4 percent of all farm households were White. However, minorities are disproportionately represented among some of the poorer groups. For households with incomes below the Census Bureau poverty line in 2003, 11.3 percent were minorities (who comprise 8 percent of all farm households). For limited-resource households, the portion is 6.3 percent and for low-income/low-wealth households, 16 percent. While minorities are somewhat overrepresented among lower income farmers (under two of the three measures), the difference is not nearly as stark as it is for the general population. There, the poverty rate for non-Hispanic Whites in 2003 was 8.2 percent, while for Blacks and Hispanics, the figures were 24.3 percent and 22.5 percent.
Geographic location. Poorer farm households are slightly more likely than average farm households to live in either persistent-poverty counties or farming-dependent counties. Persistent-poverty counties are the 386 counties in which 20 percent or more of the population was poor over the past 30 years. These counties are found mainly in the Southeast, Appalachia, and the Southwest. Eight percent of all farm households live in these counties. In comparison, 13.7 percent of all low-income/low-wealth farm households live in these counties.
Farming-dependent counties are found mainly in the Northern Great Plains and Prairie Gateway regions. In these counties, either an annual average of 15 percent or more of total county earnings were derived from farming during 1998-2000 or 15 percent or more of employed residents were working in farm occupations in 2000. Just under 10 percent of all farm households live in farming-dependent counties, compared with 11.8 percent of all low-income/low-wealth households. The picture that emerges then is one of farm poverty spread throughout the country, without marked geographic concentration.
General Safety Nets May Be the Answer
Though the farm poor do participate in today's commodity programs, the payments they receive are typically not sufficient to keep them out of poverty. In 2003, for example, 29 percent of limited-resource farms participated, garnering an average of $5,000 annually per participating farm, or 19 percent of their gross cash farm income. Much larger payments go to higher volume farms. For example, two-thirds of very large farms (sales of at least $500,000) received $71,000 per participating farm in 2003, or 7 percent of their gross cash farm income. So while the relative importance of farm payments to the poor is higher, the absolute amount is low. At any rate, the farm safety net provides no guarantee that these households surmount poverty.
The Federal policies that are important to the least well-off farmers, then, are those of the general safety net for poor people, not the farm safety net. Here the discussion focuses on the Food Stamp Program. To be eligible, a household must have income of no more than 130 percent of a poverty line derived from the Census Bureau definition. Liquid assets, such as a bank account, cannot exceed $2,000 for most households. Other assets, such as a home, are not considered in determining food stamp eligibility. Similarly, for farm households, farm-related assets—such as farmland, farm houses and buildings, farm equipment, and livestock—are not considered.
For food stamps (and most other assistance programs), a person must apply to receive benefits. A large proportion of eligible U.S. households choose not to apply. Why? Some may choose not to participate because of the embarrassment they believe they would feel using food stamps. For others, benefit levels are not high enough to induce signing up; families with incomes near the eligibility threshold receive proportionally smaller amounts of food stamps than those with lower incomes. Participation in the workforce may constrain the time a person has to sign up for food stamps; workers may be unwilling to take time off to apply. And potential food stamp recipients may have additional 'income' generated through informal activities, say through barter. For farmers, factors not shared by most of the general population—namely, the ability to grow food and a possibly greater stigma attached to receiving food stamps due to this ability—may influence their decision to participate.
In recent research using the Current Population Survey (CPS), ERS and Iowa State University analysts compared participation of eligible farm households in the Food Stamp Program with that of eligible nonfarm households. While eligible nonfarm households participated in the program at rates approaching 50 percent over the period 1988-2003, rates for poor farm households were roughly half that, at about 20 percent. What might account for this difference?
Compared with nonfarm households, farm households are more likely to have characteristics generally associated with nonparticipation. In particular, they are more likely to own their own homes, to be married, and to be White. In addition to demographic differences, eligible farm households also have higher incomes than do eligible nonfarm households. In the CPS data, average farm household income was about 20-30 percent higher than that of nonfarm households, although it was still below 130 percent of the poverty line. Households with higher incomes receive lower food stamp benefits, thereby eroding the incentive to participate.
The employment status of eligible households is another determinant of food stamp participation. While three-quarters of both farm and nonfarm households have wage and salary income, farm households are as much as five times more likely to have income from self-employment. This combination of self-employment and job-holding on the part of poor farm operators may restrict the amount of time that can be allocated to applying for Federal assistance.
| Characteristics | Eligible farm households | Eligible nonfarm households |
|---|---|---|
| Own homes | 64 | 29 |
| Married | 81 | 43 |
| White | 76 | 41 |
| Source: ERS analysis of 1989-2004 Current Population Survey data. | ||
But what if farmers and nonfarmers had identical characteristics, would farmers still have lower participation rates? In other words, is there something unique about being a farmer in terms of food stamp participation? Statistical analysis shows that even if farmers and nonfarmers had the same incomes and shared demographic characteristics, farmers would still have food stamp participation rates as much as 40 percent lower than their nonfarm counterparts. Why this might be so is a subject for future research.
So, poor farmers are not participating in these general safety net programs and are not receiving farm-specific safety net payments in the same magnitude or proportions as their better off peers. Yet, the importance of farm safety net programs to some families suggests that the programs' absence would lead to changes in the number of farm households eligible for food stamps. Ending farm safety net programs could result in as much as a 5-percent increase in the number of farm households eligible for food stamps. Such an outcome would only strengthen the need to understand the determinants of farmers' participation in food stamps.
Beyond general assistance programs, improvements in the financial well-being of poor farm families depends, as it does for the nonfarm rural poor, on the availability of employment in rural areas. The distinctive characteristics of rural labor markets, including earnings that average 20 percent below those of urban areas, limited employment opportunities, and a relatively strong reliance on extractive industry and manufacturing jobs, present unique challenges.
Contemporary Farmers, Contemporary Solutions
In the 1930s, the rejuvenation of the farm sector could have reasonably been expected to boost rural economies and the well-being of farm families. More than three-fourths of all rural counties depended on agriculture as their primary source of income. There were 30.4 million people living and working on 6.3 million farms. The rural farm population represented over half the rural population, which itself was a quarter of the U.S. total.
At the turn of the 21st century, 5.9 million people lived or worked on 2.1 million farms, representing 2 percent of total U.S. population. Only 20 percent of rural U.S. counties now depend on agriculture for more than 15 percent of earnings. Even in these farming counties, nonfarm sectors have been and continue to be major sources of employment. Compared with the circumstances of the Depression, contemporary farm policy is less significant for the rural sector, particularly for low-income farm households. Further progress in eradicating the effects of poverty on farm households depends on increasing farmers' use of the general social safety net as well as economic development and the generation of off-farm job opportunities.
Structural and Financial Characteristics of U.S. Farms: 2004 Family Farm Report, by David Banker and James M. MacDonald, USDA, Economic Research Service, March 2005
Farm Poverty and Safety Nets, Economic Research Service, November 2005, in American Journal of Agricultural Economics 87(4) 885-899.
A Safety Net for Farm Households, by Craig Gundersen, Mitch Morehart, Leslie Whitener, Linda M. Ghelfi , James Johnson, Betsey Kuhn, Ashok K. Mishra, Susan Offutt, and Laura Tiehen, USDA, Economic Research Service, October 2000