ERS Charts of Note
Subscribe to get highlights from our current and past research, Monday through Friday, or see our privacy policy.
Get the latest charts via email, or on our mobile app for  and
and 
Tuesday, April 2, 2024
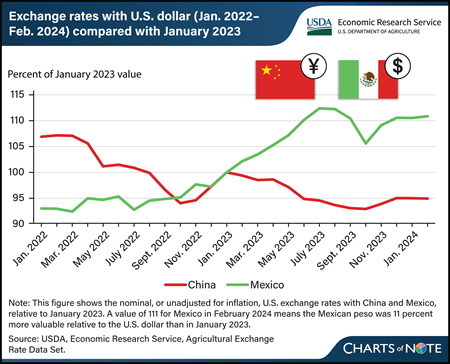
China and Mexico are the top two markets for U.S. agricultural exports by dollar value. Exchange rates are one of several factors that can influence U.S. agricultural trade. All else being equal, a stronger foreign currency favors U.S. exports to that country, and vice versa. For the past 2 years, China’s yuan has depreciated (has become less valuable) relative to the U.S. dollar, implying a weaker value of U.S. exports to China. The opposite has been true for the Mexican peso. The U.S. dollar appreciated in value relative to the currencies of many countries, including China, because of U.S. Federal Reserve interest rate increases during this period. The Mexican peso was an exception to this, as the Bank of Mexico increased interest rates more aggressively and earlier than the Federal Reserve did for U.S. interest rates. In addition, the Mexican government’s comparatively smaller stimulus response to the Coronavirus (COVID-19) pandemic in 2020 and 2021 and optimism regarding nearshoring—in which U.S. companies relocate operations to neighboring Mexico from China—has helped strengthen the peso, according to the Federal Reserve Bank of Dallas. From the perspective of U.S. farmers and agribusinesses, the decrease in the value of the yuan and increase in the value of the peso is generally associated with a decrease in export opportunities to China and an increase in export opportunities to Mexico. Not adjusting for inflation, U.S. agricultural exports to China decreased in value to $33.7 billion in fiscal year (FY) 2023 from $36.2 billion the previous year and are forecast to fall further to $28.7 billion in FY 2024. U.S. agricultural exports to Mexico increased in value from $28.0 billion to $28.2 billion from FY 2022 to 2023 and are forecast at a record high of $28.4 billion for FY 2024. This chart is drawn from USDA, Economic Research Service’s Agricultural Exchange Rate Data Set, February 2024.
Monday, April 1, 2024
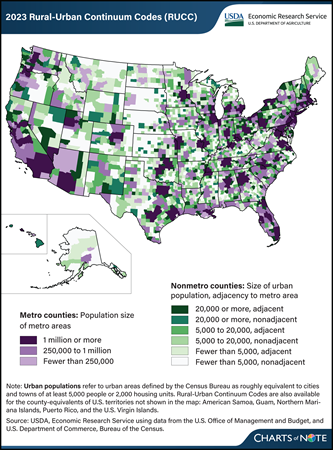
The USDA, Economic Research Service (ERS) has updated its Rural-Urban Continuum Codes (RUCC), which classify all U.S. counties into nine categories from most urban to most rural. The RUCC distinguish U.S. metropolitan (metro) counties by the population size of their metro area and nonmetropolitan (nonmetro) counties by their degree of urbanization and adjacency to a metro area. The RUCC allow researchers and policymakers to add nuance to their county-level analyses by incorporating the population of the Census Bureau’s urban areas with the OMB’s definition of metropolitan counties. The most urban counties belong to metro areas (shown in purple on the map). These are divided into three categories based on the total population of the metro area. Counties that are commonly considered rural are those that do not belong to metro areas (shown in green on the map). The RUCC classify these nonmetro counties into six categories based on the number of people who live in urban areas (small cities or towns) and whether the county is adjacent to a metro area. The most urban of the nonmetro counties are those that had urban area populations of at least 20,000 and are most prevalent in regions such as the Northeast, Great Lakes, and along the coasts. The most rural of the nonmetro counties had urban area populations of fewer than 5,000 and are the most prevalent in the Great Plains and Corn Belt. Counties classified as adjacent to metro areas are considered more urban than their nonadjacent counterparts because their residents have greater access to the diverse employment opportunities, goods, and services available in metro areas. For more information on the RUCC, please see the ERS data product Rural-Urban Continuum Codes.
Thursday, March 28, 2024
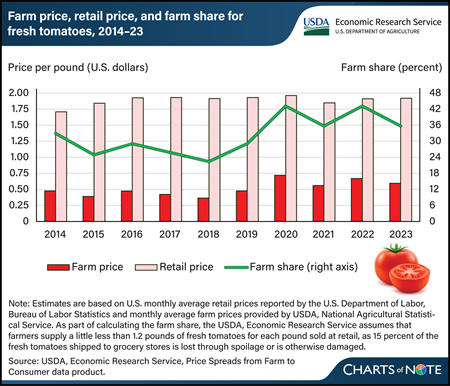
For the fourth straight year, the U.S. farm share of retail prices for fresh, field-grown tomatoes remained above 35 percent in 2023. The farm share is the ratio of what farmers receive to what consumers pay per pound in grocery stores. Retail prices have been mostly stable near $1.92 per pound since 2016. This stability has occurred despite generally higher farm prices since 2020. Farm prices, the amount growers received per pound of fresh tomatoes, fell 7 cents in 2023 from 2022, based on a simple average of monthly prices. USDA, Economic Research Service (ERS) estimates farm-to-retail price spreads for field-grown, fresh-market tomatoes using a simple average of monthly retail prices reported by the U.S. Department of Labor, Bureau of Labor Statistics and monthly farm-level prices reported by the USDA, National Agricultural Statistical Service (NASS). This approach gives equal weight to all months of the year. Same-month farm prices were lower during much of 2023 compared with 2022. However, production is seasonal. In 2023, farm prices were higher during peak domestic production periods than they were during the same periods in 2022. NASS season average price data show farm prices were up about 3.5 cents per pound on an annual basis that gives more weight to months with greater domestic production. The farm share of retail prices would have been even higher in 2023 if viewed on this basis. More information on ERS farm share data can be found in the Price Spreads from Farm to Consumer data product, updated February 27, 2024.
Wednesday, March 27, 2024
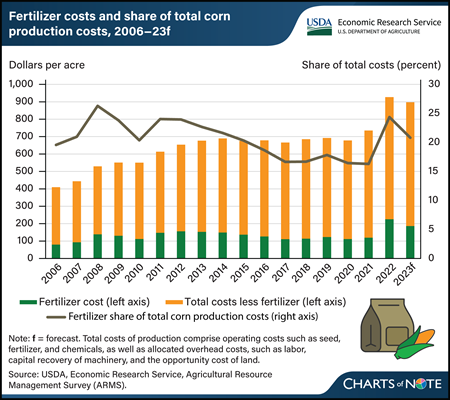
Fertilizer is one of several inputs corn growers buy in the months before April and May, when most U.S. corn acres are planted. Historically, fertilizer is typically the largest variable expense associated with corn production. Every May, USDA’s Economic Research Service (ERS) reports production costs, including fertilizer, for corn and other major commodities in the Commodity Costs and Returns data product. Although fertilizer costs have varied over time, the average cost of fertilizer per acre from 2006 to 2021 was around $125, not adjusting for inflation. Costs jumped to an average of $225.78 per acre in 2022, and then fell to an estimated $186.73 in 2023. This represents an 89-percent increase from 2021 to 2022 followed by a decrease of 17 percent from 2022 to 2023. In addition to fertilizer expenses, other costs of production reported in the data include operating costs, such as seed, fuel, and chemicals, as well as allocated overhead costs, such as labor, capital recovery of machinery, and the opportunity cost of land—a category that reflects rent or income that might have been earned from renting out the land when the land is owned. Fertilizer costs accounted for about 22 percent of total corn production costs per acre from 2006 to 2016, then fell to historical lows averaging around 17 percent from 2017 to 2021. In 2022, price spikes resulted in fertilizer costs jumping to about 24 percent of total costs. While elevated, fertilizer expenses as a share of total costs remained lower in 2022 compared with 2008, when they were 26 percent of total costs. From 2022 to 2023, total corn production costs remained elevated compared with 2021 and before, even as fertilizer costs declined. Iowa prices published by USDA’s Agricultural Marketing Service for the most commonly used fertilizers anhydrous ammonia, urea, and liquid nitrogen (32 percent) show decreases from 2023 to 2024, with slight upticks in the second reporting period of February. Cost of production data for 2023 is set to be released on May 1, 2024. This chart is drawn from the ERS Commodity Costs and Returns data product.
Tuesday, March 26, 2024
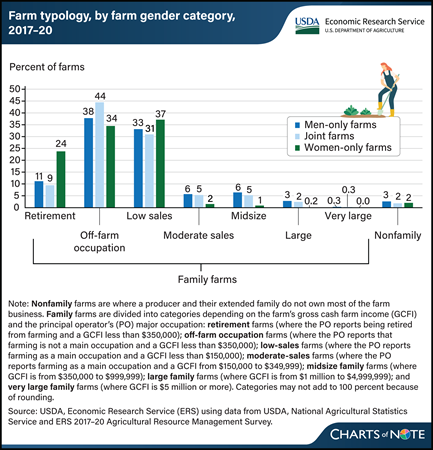
Most farms operated only by women are retirement, off-farm occupation, or low-sales farms, according to findings by researchers with USDA, Economic Research Service (ERS). After examining 2017–20 data from the Agricultural Resource Management Survey (ARMS), researchers found that a greater share of farms operated only by women were retirement farms compared with the shares operated only by men or by men and women jointly, 24 versus 11 and 9 percent, respectively. Retirement farms generate annual gross cash farm income (GCFI) of less than $350,000 with principal operators who report they are retired from farming. Three percent of men-only operations were large family farms (with GCFI of $1 million to $4,999,999), compared to 2 and 0.2 percent of farms operated jointly by men and women, or only women respectively. The ARMS data also show that 7 percent of all farms were operated entirely by women from 2017 to 2020, and 44 percent of all farms were operated jointly by men and women, so 51 percent of all farms had at least one woman operator. For more information, see the ERS report An Overview of Farms Operated by Socially Disadvantaged, Women, and Limited Resource Farmers and Ranchers in the United States, published February 2024.
Monday, March 25, 2024
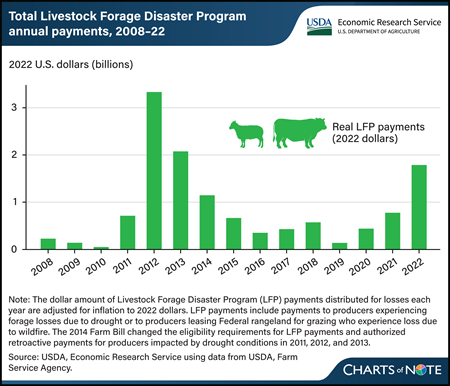
The USDA, Farm Service Agency administers the Livestock Forage Disaster Program (LFP), which provides payments to livestock producers affected by drought. From 2008 to 2022, the program distributed more than $12 billion (in 2022 dollars) in total to livestock producers throughout the United States. Annual LFP payments peaked in 2012 at more than $3 billion (in 2022 dollars) when severe, widespread drought conditions were prevalent throughout much of the central United States, where much of the Nation’s livestock production is concentrated. In general, years with widespread drought (such as in 2012, 2013, and 2022) are associated with larger total annual LFP payments. LFP eligibility is based on drought severity as reported by the U.S. Drought Monitor. If drought conditions become more severe and common in the future because of climate change, LFP payments may increase, with potential impact on the Federal Government’s budget. For more about the LFP and the potential impact of LFP payments on the Federal budget, see the USDA, Economic Research Service report The Stocking Impact and Financial-Climate Risk of the Livestock Forage Disaster Program, published in January 2024.
Thursday, March 21, 2024
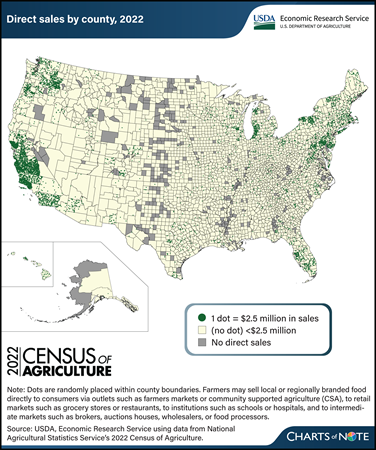
Errata: On March 25, 2024, the map legend was revised to show that areas in yellow without dots represent direct sales of less than $2.5 million.
The Census of Agriculture reports data on local or regionally branded food sold directly to retail outlets, institutions (like schools), intermediate markets (like food hubs), and consumers (via outlets such as farmers markets). These local-food sales channels provide opportunities for farmers to explore revenue streams beyond traditional wholesale markets. Data from the 2022 Census of Agriculture, released in February 2024, show producers sold $17.5 billion in food, including both unprocessed and processed (value-added) food, through direct marketing channels. That was a 25-percent increase (after adjusting for inflation) since the 2017 Census of Agriculture and an annual real growth rate of 4.6 percent. The increase from 2017 was driven by a surge in food sold directly to retail outlets, institutions, and intermediate markets. From 2017 to 2022, sales through these three direct-sales channels increased 33.2 percent (adjusted for inflation) to $14.2 billion, and the number of operations selling through them more than doubled to 60,332. Direct-to-consumer sales through farmers markets, on-farm stores or stands, u-pick operations, community supported agriculture (CSA), and online marketplaces remained consistent with those in 2017 after adjusting for inflation. However, the number of farm operations (116,617) selling directly to consumers in 2022 was 10.3 percent less than in 2017. As was the case in 2017, direct food sales continue to be concentrated along the West Coast, particularly in California (37.7 percent of direct sales), and in the Northeast. Most counties with high volumes of direct sales are in or around metropolitan areas, whose populations provide a large customer base for producers. This chart is based on data obtained from USDA, National Agricultural Statistics Service’s 2022 Census of Agriculture. For more on direct food sales, see the USDA, Economic Research Service report Marketing Practices and Financial Performance of Local Food Producers: A Comparison of Beginning and Experienced Farmers, published in 2021.
Wednesday, March 20, 2024
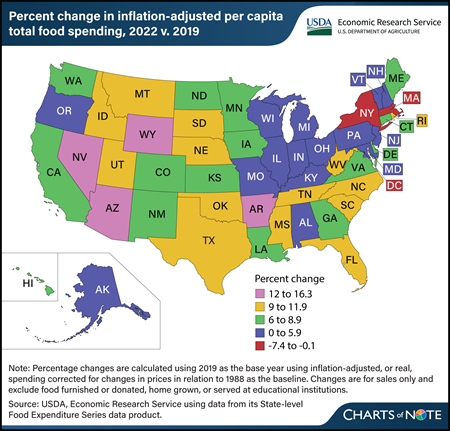
The U.S. food system experienced many changes since 2019, particularly during the Coronavirus (COVID-19) pandemic. Per capita total U.S. food spending increased 6.3 percent in 2022 compared with 2019 when adjusted for inflation. Inflation-adjusted food-at-home spending approached 2019 levels in 2022, while food-away-from-home spending remained high compared with prepandemic levels. However, this trend was not consistent across States. Washington, DC, had the largest decrease in total food spending between 2019 and 2022 (7.4 percent), mainly driven by a 12.9-percent decline in food-away-from-home spending. States with decreases or relatively small increases in total food spending were largely concentrated in the Northeast. Massachusetts and New York each saw decreases of 0.7 percent in inflation-adjusted, per capita total food spending between 2019 and 2022, while food spending in Vermont grew 1.6 percent. Many States with the largest increases in inflation-adjusted, per-capita food spending were concentrated in the West, with Nevada (16.3 percent), Wyoming (15.5 percent), and Arizona (13.9 percent) seeing the largest increases over the period. This chart is drawn from USDA, Economic Research Service’s State-level Food Expenditure Series, updated February 2024. For more on food spending, see the Amber Waves article U.S. Consumers Spent More on Food in 2022 Than Ever Before Even After Adjusting for Inflation, published September 2023.
Tuesday, March 19, 2024
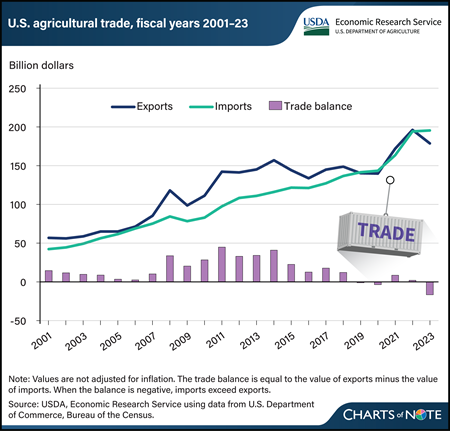
The U.S. agricultural trade balance measures the difference between the values of exported farm goods and those imports from other countries. For nearly 60 years, U.S. agricultural trade maintained a surplus, but in fiscal year (FY) 2019, the balance shifted to a deficit, where it has stayed 3 out of the last 5 fiscal years. In FY 2023, U.S. agricultural imports exceeded exports by $16.6 billion. Imports have largely followed a stable upward trend, while exports have had relatively wide swings. From FY 2013 to 2023, import values increased at a compound annual growth rate of 5.8 percent, and exports grew at a rate of 2.1 percent. Although the U.S. agricultural trade balance is closely watched, it reflects changing consumer tastes, a robust economy, and a strong dollar, and is not an indicator of export competitiveness or import dependence. The U.S. consumer’s growing appetite for high-valued imported goods—such as fruits and vegetables, alcoholic beverages, and processed grain products—has contributed to the expanding trade deficit. Those goods often include products that can’t be easily sourced in the United States, such as tropical products or off-season produce. In contrast, nearly 40 percent of U.S. exports are bulk commodities, whose prices respond more rapidly to global markets. This chart also appears in the USDA, Economic Research Service report Selected Charts from Ag and Food Statistics: Charting the Essentials, 2024.
Monday, March 18, 2024
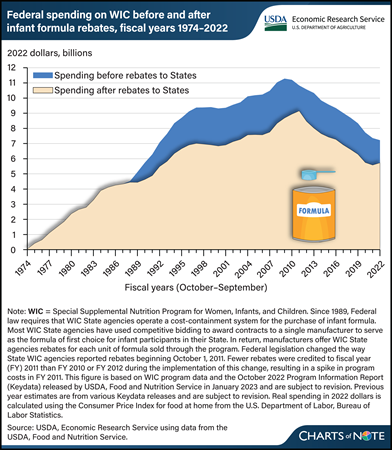
The Special Supplemental Nutrition Program for Women, Infants, and Children (WIC) serves to safeguard the health of low-income pregnant and postpartum women, infants, and children younger than 5 years who are at nutritional risk. State agencies responsible for implementing WIC use cost-containment strategies to reduce program costs. The greatest savings come from strategies used to contain the costs of providing infant formula through the program. Since 1989, most WIC State agencies have used competitive bidding to award contracts to a single manufacturer to serve as the formula of first choice for infant participants in their State. In return, manufacturers offer WIC State agencies rebates for each unit of formula sold through the program. From 1989 to 2022, savings to WIC from the rebates totaled $71.9 billion (in inflation-adjusted 2022 dollars), or 23 percent. Without the rebates, the Federal Government would have spent about $307.5 billion on the WIC program over that period. With the rebates, the Government spent $235.6 billion. This chart is drawn from the USDA, Economic Research Service report The Special Supplemental Nutrition Program for Women, Infants, and Children (WIC): Background, Trends, and Economic Issues, 2024 Edition, published in February 2024.
Thursday, March 14, 2024
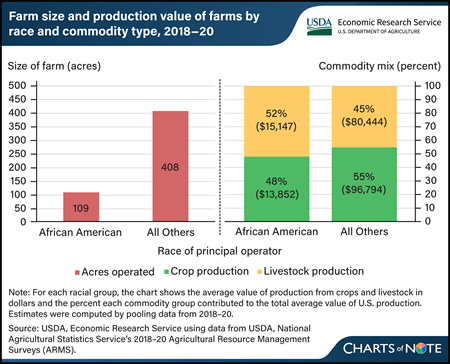
Researchers at USDA’s Economic Research Service (ERS) evaluated characteristics of farms operated by African Americans using data from the 2018–20 Agricultural Resource Management Surveys (ARMS). The researchers observed that farm size and commodities produced differed across race. During 2018–20, the average African-American-operated farm was less than one-third the size of other farms. African-American farms operated an average of 109 acres compared with an average of 408 acres for all other farms. The choice of commodities produced also varied by race. About 83 percent of African-American farms were livestock farms, with livestock production making up more than half of their production value. In contrast, about 66 percent of other farms were livestock farms. The differences in farm size and commodities produced were found to contribute to differences in farm production values. On average, total value of production was about $29,000 for African-American farms, while that of farms with principal operators of other races was about $177,000. Together, these factors contributed to the average African-American farm earning lower net farm income than other farms. This article is drawn from the ERS Amber Waves article Farm Size, Specialization Are Among Factors Influencing Financial Performance of African-American Farms in United States, published in February 2024.
Wednesday, March 13, 2024
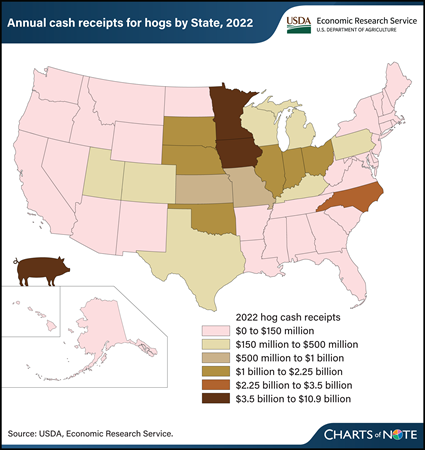
Iowa is the top producer of hogs in the United States, with about $10.9 billion in cash receipts in 2022. Cash receipts represent the value of sales of hogs by farmers to processors or final users. Following Iowa are Minnesota, North Carolina, and Illinois, with cash receipts of $3.6 billion, $3.1 billion, and $2.1 billion, respectively. Iowa accounted for about 35.5 percent of the $30.6 billion in total U.S. cash receipts for hogs in 2022. The top 10 hog-producing States cumulatively accounted for 87.6 percent of hog receipts. The latest Hogs and Pigs report from USDA, National Agricultural Statistics Service indicated there were nearly 75 million hogs in the United States as of December 1, 2023. USDA, Economic Research Service (ERS) estimates farm sector cash receipts—the cash income received from agricultural commodity sales—three times each year. These data include estimates broken down by State and commodity and offer background information on the Nation’s agriculture. The information in this chart is available in the ERS Farm Income and Wealth Statistics data product, updated in February 2024.
Tuesday, March 12, 2024
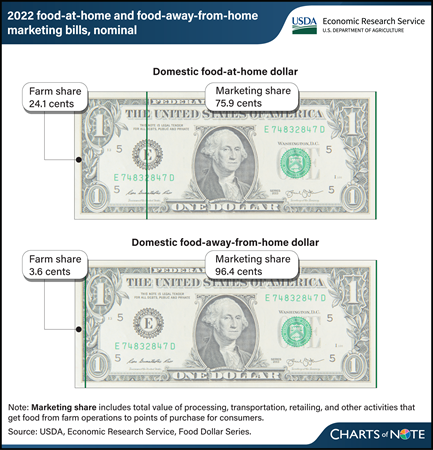
In 2022, farm establishments received 24.1 cents for each dollar spent on food at home and 3.6 cents for each dollar spent on food away from home. These amounts, called farm shares, highlight the different paths that food takes from farms to consumers' points of purchase. Food-at-home dollars include food purchases from outlets such as grocery stores, supermarkets, and wholesale clubs that are meant to be prepared at home. Food-away-from-home dollars include food purchases at restaurants, including delivery and carry-out, and other venues where the food is eaten on the premises. The remainder of each food dollar makes up the marketing share, which is the total value of processing, transportation, retailing, and other activities that get food from farm operations to points of purchase for consumers. In 2022, the marketing share was 75.9 cents per food-at-home dollar and 96.4 cents per food-away-from-home dollar. The marketing share can change based on many factors, such as consumer preferences and the costs of production inputs. The marketing share is higher for food away from home because of the higher costs of preparing and serving meals. Find additional information in the USDA, Economic Research Service’s (ERS) Amber Waves article ERS Food Dollar's Three Series Show Distributions of U.S. Food Production Costs, published in December 2023, and the ERS Food Dollar Series data product, updated November 15, 2023.
Monday, March 11, 2024
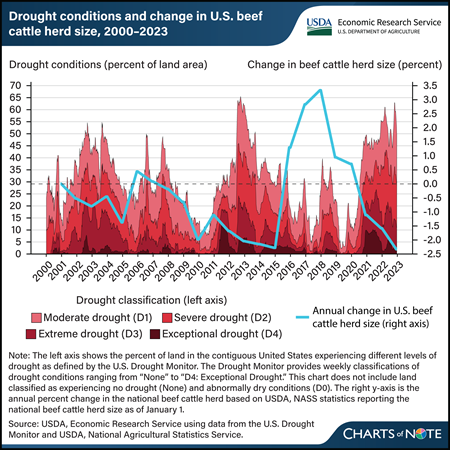
Beef cattle operations that rely on precipitation to grow forage to feed their herds are particularly vulnerable to drought. When drought conditions diminish forage production and availability, beef cattle producers often must buy supplemental feed and forage or reduce their herd size. Periods of more intense drought are associated with decreases in the U.S. beef cattle herd size, such as when the national beef cattle herd shrank about 1 to 2 percent a year during drought between 2011 and 2015. This chart also shows that cattle numbers grew in the less intense drought years of 2015 to 2018. Other factors outside of drought conditions also influence changes in the beef cattle herd size, including feed and forage prices, extreme precipitation events, supply chain issues, and the natural life cycles of livestock (i.e., the cattle cycle). To support livestock producers negatively impacted by drought conditions, the USDA administers a range of programs such as the USDA, Farm Service Agency’s Livestock Forage Disaster Program (LFP), which provides payments to livestock producers whose forage production is diminished by drought. LFP eligibility is determined by drought conditions reported by the U.S. Drought Monitor. Many livestock species, ranging from beef cattle to reindeer, are eligible for LFP payments. LFP payment rates are species specific and designed to cover about 60 percent of monthly feed and forage costs. For more about the U.S. beef cattle herd, the LFP, and the potential impact of LFP payments on the Federal budget, see the USDA, Economic Research Service report The Stocking Impact and Financial-Climate Risk of the Livestock Forage Disaster Program, published in January 2024.
Friday, March 8, 2024
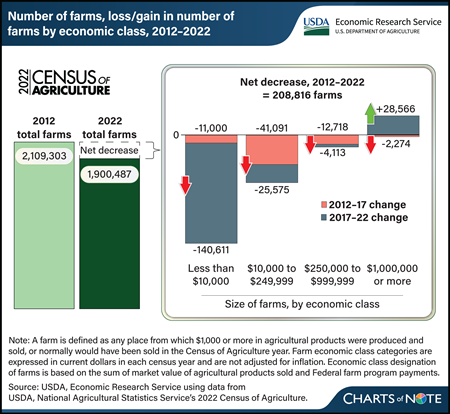
In 2022, farms in the United States numbered 1,900,487, down from 2,109,303 in 2012, according to data from the 2022 USDA Census of Agriculture released in February 2024. That represented a 10-percent (208,816 farms) decline from 2012 to 2022. The Census of Agriculture is a complete count of U.S. farms conducted every 5 years by USDA, National Agricultural Statistics Service. As such, it provides a picture of how different-sized farms, categorized by economic class, changed. In looking at the last two 5-year survey periods, the number of farms decreased in all four farm size categories from 2012 to 2017, represented by the red part of bars in the chart. From 2017 to 2022 (represented by gray part of bars), there was an overall decrease in the number of farms, with a drop in the smallest three economic class categories and an increase in the number of farms with annual revenue of $1 million or more. Farms with annual revenue of less than $10,000 dropped the largest in number within the decade, declining by 151,611 farms, or 13 percent. On the other hand, large farms of $1 million or more in revenue increased by 32 percent, that is, from 81,660 farms in 2012 to 107,952 farms in 2022. The number of farms with $10,000 to $249,999 in revenue declined by 66,666 (a 9-percent decrease) from 2012 to 2022, and farms with revenue of $250,000 to $999,999 declined by 16,831 (a 10-percent decrease). To explore the 2022 Census of Agriculture, see the NASS Census of Agriculture website. For more information on farm structure and its relationship with agriculture, as well as other statistics on the financial performance of farms and ranches, see USDA, Economic Research Service’s report America’s Farms and Ranches at a Glance: 2023 Edition, published in December 2023, which draws on data from the NASS Agricultural Resources Management Survey (ARMS) of farm operations in 2022.
Thursday, March 7, 2024
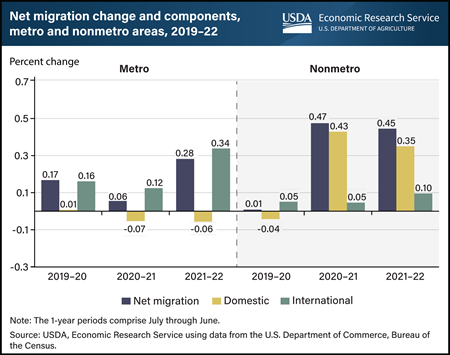
Both rural (nonmetro) and urban (metro) populations grew because of increased migration over the last few years; however, the sources of the increased migration are different. In 2020–21 and 2021–22, rural areas experienced an increase in population because more people moved from urban to rural areas than in the opposite direction, a reversal of domestic migration trends from the previous decade. Domestic migration occurs when people move among areas within the United States. Net domestic migration in rural areas jumped from near zero in 2019–20 to more than 0.35 percent in the last two years. Fear of exposure to Coronavirus (COVID-19) in urban areas and the subsequent increase in remote work contributed to this dramatic shift in migration patterns. Conversely, urban areas increased their population through migration from other countries. International migration to urban areas reached a peak of 0.34 percent in 2021–22. The growth in migration rates for both urban and rural areas are somewhat offset by elevated death rates (which are falling from pandemic highs) and lower birth rates. This chart is drawn from the USDA, Economic Research Service report Rural America at a Glance, published in November 2023.
Wednesday, March 6, 2024
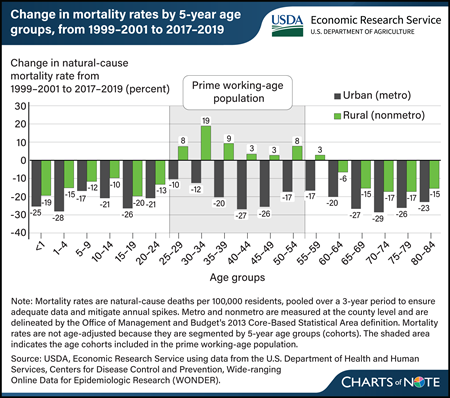
Over the last two decades, disease-related (natural-cause) mortality rates have widened between rural and urban areas, especially for the prime working-age population (aged 25–54). Researchers with USDA, Economic Research Service (ERS) compared natural-cause mortality in rural and urban areas between two 3-year periods, 1999–2001 and 2017–2019. They found the gap between rural and urban natural-cause mortality rates widened between the two time periods. Natural-cause mortality rates decreased across all age groups in urban areas. In rural areas, mortality rates decreased for most age groups (although not as much as for the same groups in urban areas) but increased for the prime working-age population. The rural group with the largest increase (19 percent) in natural-cause mortality rates was 30- to 34-year-olds. Increased mortality rates for people who are of prime working age are an indicator of worsening population health, which could have negative implications for rural families, communities, employment, and the economy. This chart appears in the ERS report The Nature of the Rural-Urban Mortality Gap, published in March 2024.
Tuesday, March 5, 2024
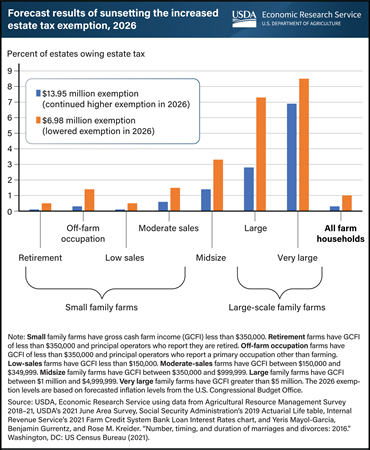
The 2017 Tax Cuts and Jobs Act (TCJA) made significant changes to Federal individual income and estate tax policies, though some policies were temporary. In 2018, the TCJA increased the estate tax exemption amount from $5.49 million to $11.18 million. This increase is set to expire at the end of 2025. The exclusion amount will revert in 2026 to the pre-TCJA level, adjusted for inflation, of $6.98 million per deceased person. For married couples, a portability provision in estate tax law allows the surviving spouse to use any unused portion of the deceased spouse’s exemption. Researchers with the USDA, Economic Research Service (ERS) estimated the expiring increased exemption would be $13.95 million per person at the time of the expiration. Lowering the level of the estate tax exemption in 2026 is estimated to increase the percent of farm operator estates taxed from 0.3 to 1.0. This means that of the estimated 40,883 estates that are expected to be created in 2026, the expiration of the increased exemption would raise the number of estates that owe tax from 120 to 424. Large farms (gross cash farm income between $1 million and $5 million) would experience the largest increase in the share of estates owing estate tax, increasing from 2.8 to 7.3 percent. Total Federal estate taxes for farm estates would be expected to more than double to $1.2 billion if the provision were allowed to expire. The information in this chart appears in the ERS publication An Analysis of the Effect of Sunsetting Tax Provisions for Family Farm Households published in February 2024.
Monday, March 4, 2024
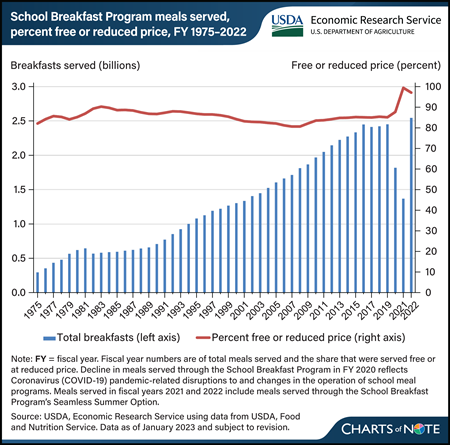
The USDA’s School Breakfast Program (SBP) has served about 63 billion meals since it was permanently authorized as a Child Nutrition Program in 1975. Any student in a participating school can get breakfast through the program. Students can receive a free breakfast if their household’s income is at or below 130 percent of the Federal poverty line (FPL), a reduced-price breakfast if their household’s income is between 130 and 185 percent of the FPL, and a full-price breakfast if their household’s income is above 185 percent of the FPL. The number of breakfasts served increased each year from 1982 through fiscal year (FY) 2016, before plateauing at about 2.4 billion meals from FY 2017 through FY 2019. On average, 85 percent of breakfasts were served for free or at a reduced price each year during this period. The onset of the Coronavirus (COVID-19) pandemic in March 2020 interrupted school operations, including the provision of meals, and the number of breakfasts served through the SBP dropped to about 1.8 billion breakfasts in FY 2020. The decrease reflected the use of USDA pandemic waivers, which allowed schools to serve meals through the Summer Food Service Program. From the end of FY 2021 through FY 2022, schools transitioned to serving meals through the SBP’s Seamless Summer Option. In FY 2022, the SBP provided 2.5 billion breakfasts, similar to prepandemic years. The data for this chart are from the USDA, Economic Research Service’s School Breakfast Program topic page.
Thursday, February 29, 2024
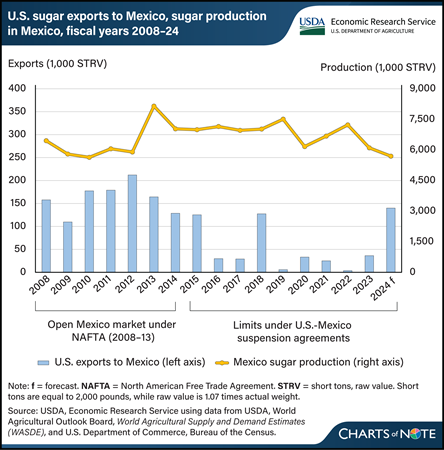
U.S. sugar exports for fiscal year 2024 are forecast to be the largest in 6 years, rising to an estimated 160,000 short tons, raw value (STRV) in the February 2024 World Agricultural Supply and Demand Estimates (WASDE) report. About 88 percent of that volume is expected to go to Mexico, where sugar production has fallen to a 15-year low. This would put U.S. sugar exports to Mexico on par with those during 2008–13, when the North American Free Trade Agreement (NAFTA) was active. Under NAFTA, Mexico could import U.S. sugar without tariffs or quotas, and U.S. exports averaged 167,000 STRV while the trade agreement was in effect. At the time, most of the sugar was imported by Mexico-based manufacturers participating in a promotion program commonly known as IMMEX. The program provided tax incentives if the companies used imported U.S. sugar in food products that would be re-exported within a certain amount of time. In 2014, in response to U.S. investigations into subsidies affecting sugar imports from Mexico, the two countries reached agreements that suspended the investigations and restricted the price and quantity of Mexico’s sugar exports to the United States. Mexico then declared that sugar imported from the United States would no longer qualify for duty-free treatment under IMMEX if that sugar was the beneficiary of the U.S. version of a re-export program. After that, U.S. sugar exports to Mexico fell to below 50,000 STRV, on average, each fiscal year. In the last 2 years, however, the United States increased its sugar exports to Mexico as U.S. domestic beet and cane sugar production rose and Mexico experienced back-to-back years of low production related to drought and reduced fertilizer use. This chart is based on information in the USDA, Economic Research Service’s Sugar and Sweeteners Outlook: February 2024.


